Data Visualization Courses
Choose a course that suits your goals - from the basics to advanced skills in data visualization.
4.6
Rated based on 29 reviews.
7,469 Learners
Already enrolled
Gained skills:
Data Visualization Techniques Data Preprocessing Data Visualization Exploratory Data Analysis Data Analysis with Excel Excel Formulas Data Aggregation with pandas Data Indexing and Selection in pandas Handling Outliers Excel Power Query Excel for Beginners Excel Automation Power Query Advanced Data Manipulation Data Modeling Power Pivot Handling Machine Learning Techniques Neural Networks Python Programming Python Data Manipulation Data Analysis Data Handling Python Visualization Python Visualization with Matplotlib Seaborn Visualization
Show MoreTake a short quiz and get closer to your goals!
80,000
Students have already successfully completed the courses and are applying their skills in the workplace
92%
Users find our courses useful
Courses
Courses
Career paths
Advantages
Why Codefinity
Career opportunities
FAQs
Related topics
Reviews
Pricing
Top courses
Courses
Courses
Career paths
Advantages
Why Codefinity
Career opportunities
FAQs
Related topics
Reviews
Pricing
Top courses
Browse Data Visualization courses and projects
Level
Type of lesson
Technologies
Choose a career pathComprehensive programs to master a career pathway
Codefinity advantages
AI-Assisted Learning
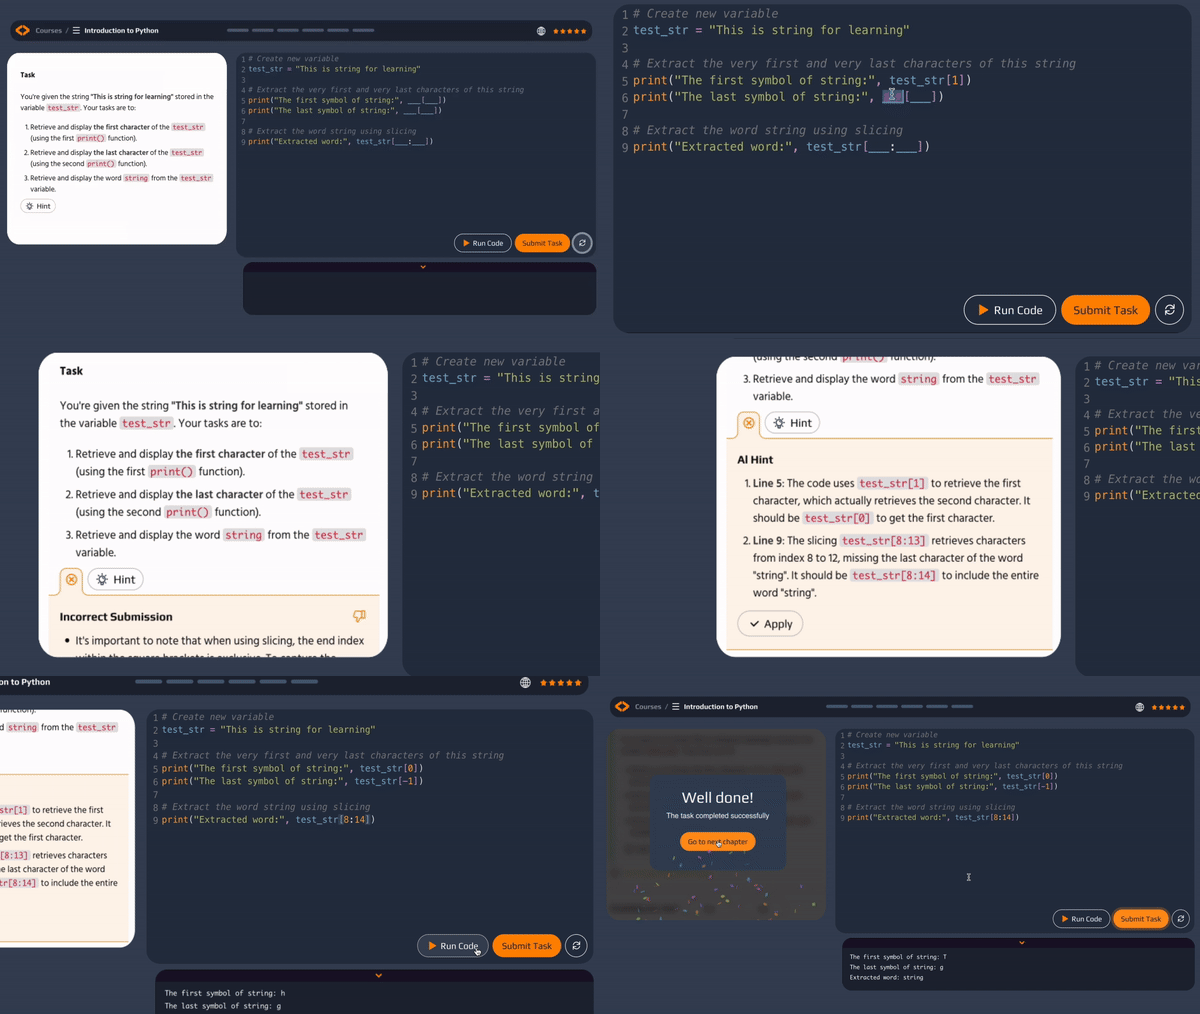
Embrace the fascination of Tech Skills! Our AI-assistant provides real-time feedback, personalized hints, and error explanations, empowering you to learn with confidence.
Workspaces
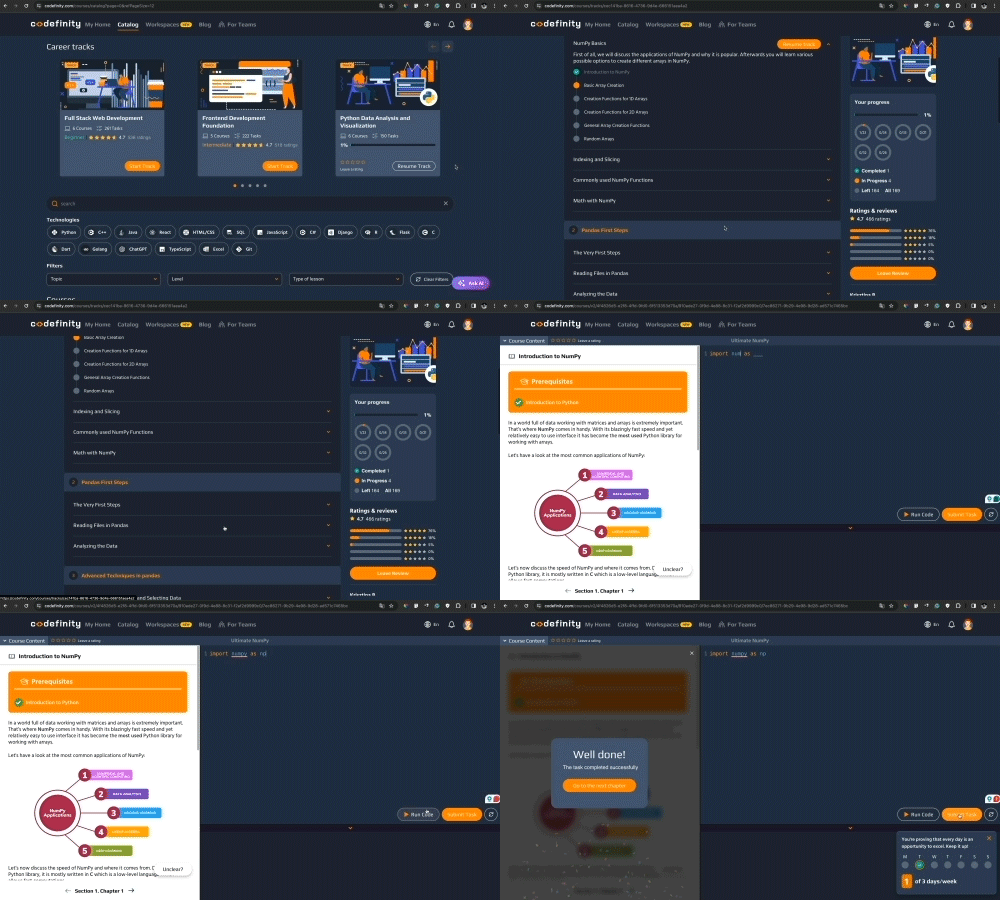
With Workspaces, you can create and share projects directly on our platform. We've prepared templates for your convenience
Learning tracks
Take control of your career development and commence your path into mastering the latest technologies
Real-world projects
Real-world projects elevate your portfolio, showcasing practical skills to impress potential employers
Why Codefinity stands out
Video content
Downloadable materials
Esteemed certificates
Interactive learning environment
Error correction
AI assistant
Access to all content with one subscription
Codefinity
Video-based learning platforms
Codefinity
Video-based learning platforms
Video content
Downloadable materials
Esteemed certificates
Interactive learning environment
Error correction
AI assistant
Access to all content with one subscription
Career opportunitiesLearn about the most popular professions, average salaries, and companies actively seeking specialists in this field.
Data Visualization Specialist
Data Scientist
Data Analyst
Machine Learning Engineer
Big Data Analyst
$149k
$197k
$246k
Min
Average
Max
Annual sallary
(Average in the US)
Hiring companies
*Source: Glassdoor
Chosen by students of top schools
Including 30 out of top-30 U.S. colleges
Data Visualization Courses: Key Info and Questions
Introduction to Data Visualization
Data Visualization is the graphical representation of data to help people understand complex data patterns and derive meaningful insights. It involves using visual elements like charts, graphs, and maps to make data more accessible and easier to interpret.
Benefits of Our Data Visualization Courses
Our courses offer in-depth training on various data visualization tools and techniques, hands-on projects, and real-world applications, preparing you for a successful career in data visualization.
Career Opportunities After Completion of Data Visualization Courses
Graduates can pursue roles such as Data Visualization Specialist, Business Intelligence Analyst, Data Analyst, and Data Scientist in various industries, including finance, healthcare, marketing, and technology.
Data Visualization Course Options
We offer a range of courses, including: Visualization in Python with matplotlib, Ultimate Visualization with Python, First Dive into seaborn Visualization, Deep Dive into the seaborn Visualization
Certificate Information
Upon completion of our data visualization courses, you will receive a certificate with a unique ID that validates your skills and knowledge, enhancing your credibility and career prospects.
How to Choose the Suitable Data Visualization Course?
To choose the right course, consider your current skill level, the tools you want to learn, the course curriculum, and reviews from other students. Select a course that offers practical exercises and projects relevant to your career goals.
Which Course Is Best in the Category of Data Visualization Courses?
The best course depends on your needs. Beginners should start with courses like Visualization in Python with matplotlib or First Dive into seaborn Visualization, while more experienced individuals might prefer advanced courses like Ultimate Visualization with Python or Deep Dive into the seaborn Visualization.
Why Should I Consider Taking an Online Data Visualization Course with Your Company?
Our online courses provide flexibility, interactive real-world examples and tasks, and useful guidelines, ensuring you gain practical skills that can be applied directly to your job.
Tips for Successful Data Visualization Course Completion
Stay organized, practice regularly by completing the tasks using as few hints as possible, and apply what you learn through our hands-on projects.
What Is the Cost of Training for Data Visualization Courses?
The cost of training varies depending on the subscription type and duration. For the most accurate and detailed pricing information, as well as any available discounts or financial aid options, please visit our payment page.
Which Data Visualization Course Is Best Suited for Beginners?
Beginners should start with introductory courses like Visualization in Python with matplotlib or First Dive into seaborn Visualization, which cover the basics and offer practical exercises to build foundational skills.
What Are the Key Skills Required to Excel in Data Visualization?
Key skills include understanding data analysis, proficiency in visualization tools, knowledge of design principles, the ability to interpret data accurately, and effective communication skills to present insights clearly.
How Does Data Visualization Impact the Field of Business Intelligence?
Data visualization enhances business intelligence by providing clear, actionable insights from complex data sets. It helps organizations make informed decisions, identify trends, and improve overall business performance.
What Are the Differences Between Data Visualization and Data Analytics?
Data Visualization focuses on presenting data in graphical formats to make it more accessible and understandable, while Data Analytics involves examining data sets to draw conclusions and make predictions based on the information they contain.
What Our Users Say
Join 1.5+ million advancing in AI and data skills at Codefinity
Ready to get started?
ProBest intro offer$12 /monthBilled annually
100+ Top-Rated courses
Completion certificates
AI-Assistant in all courses
20+ hands-on Real-world projects
Personalized study tracks
Unlimited workspaces
UltimateAll you need to to boost your career$25 /monthBilled annually
100+ Top-Rated courses
Completion certificates
AI-Assistant in all courses
20+ hands-on Real-world projects
Personalized study tracks
Unlimited workspaces
Top courses in the Data Visualization category
1. | Data Analysis with Excel | 2 hours | 15 chapters |
2. | Excel for Beginners | 4 hours | 49 chapters |
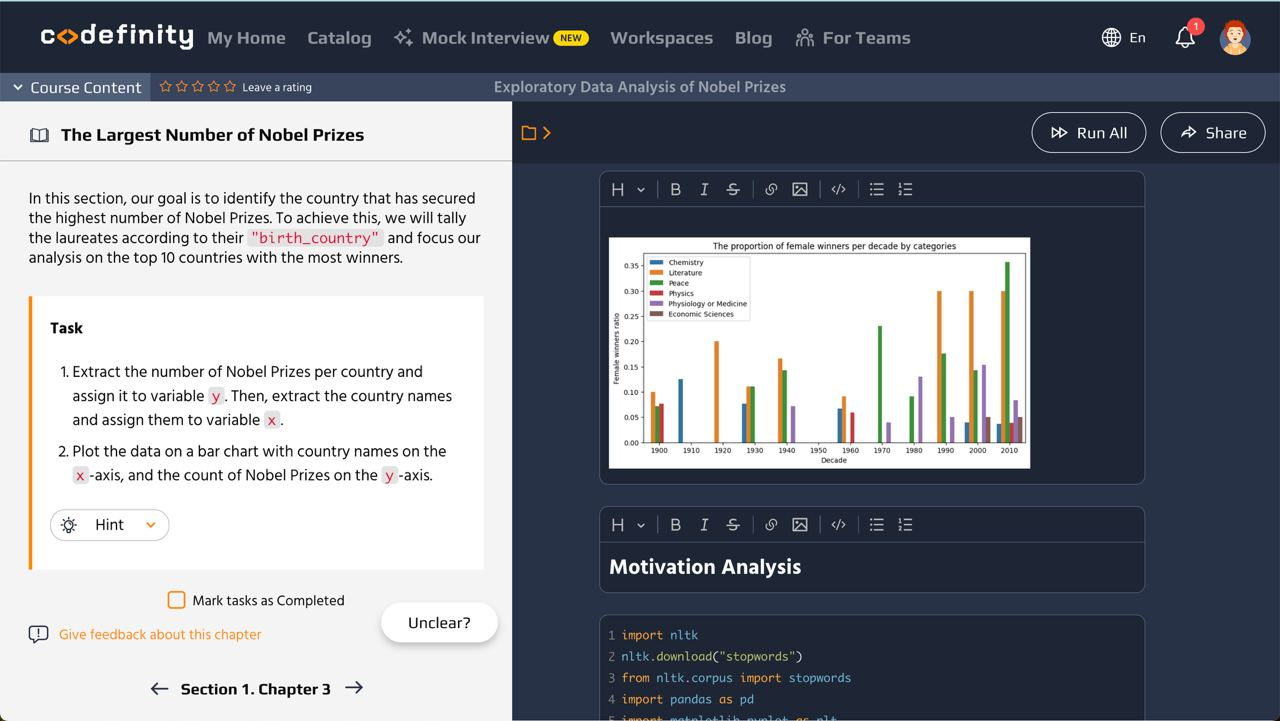
3. | Conducting Exploratory Data Analysis of Nobel Prizes | 1 hours | 6 chapters |
4. | Excel for Finance | 3 hours | 22 chapters |
5. | Recognizing Handwritten Digits | 2 hours | 10 chapters |
1. Data Analysis with Excel
Hours
2Chapters
152. Excel for Beginners
Hours
4Chapters
493. Conducting Exploratory Data Analysis of Nobel Prizes
Hours
1Chapters
64. Excel for Finance
Hours
3Chapters
225. Recognizing Handwritten Digits
Hours
2Chapters
10