 Kdeplot
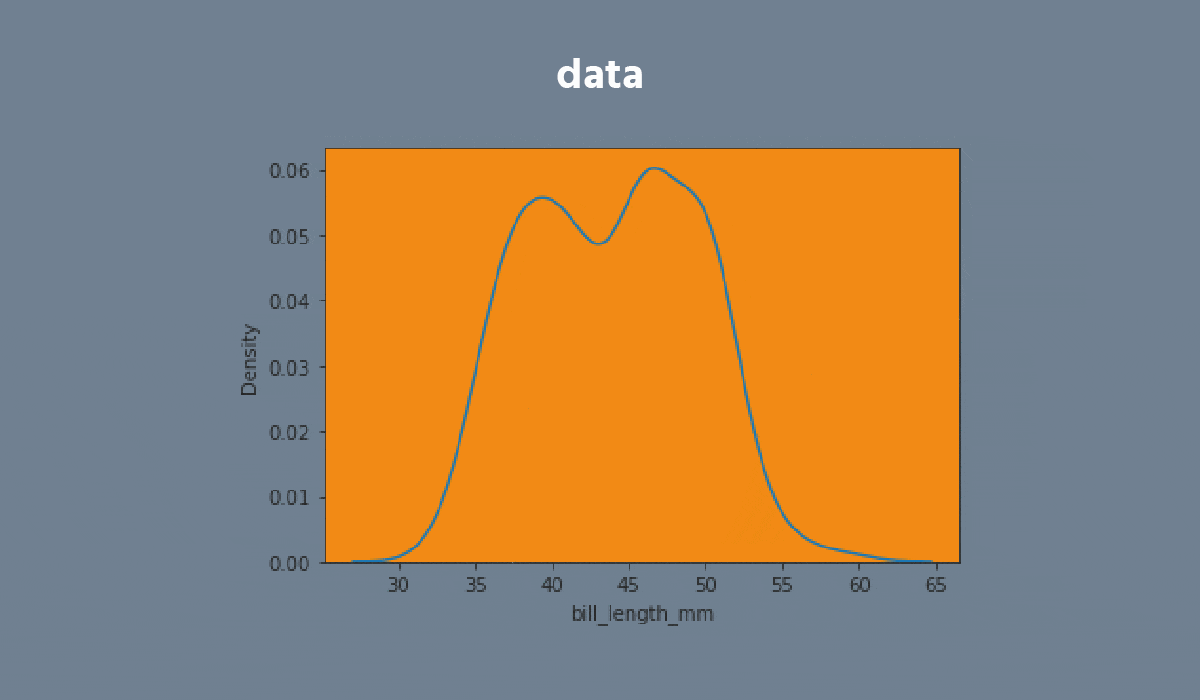
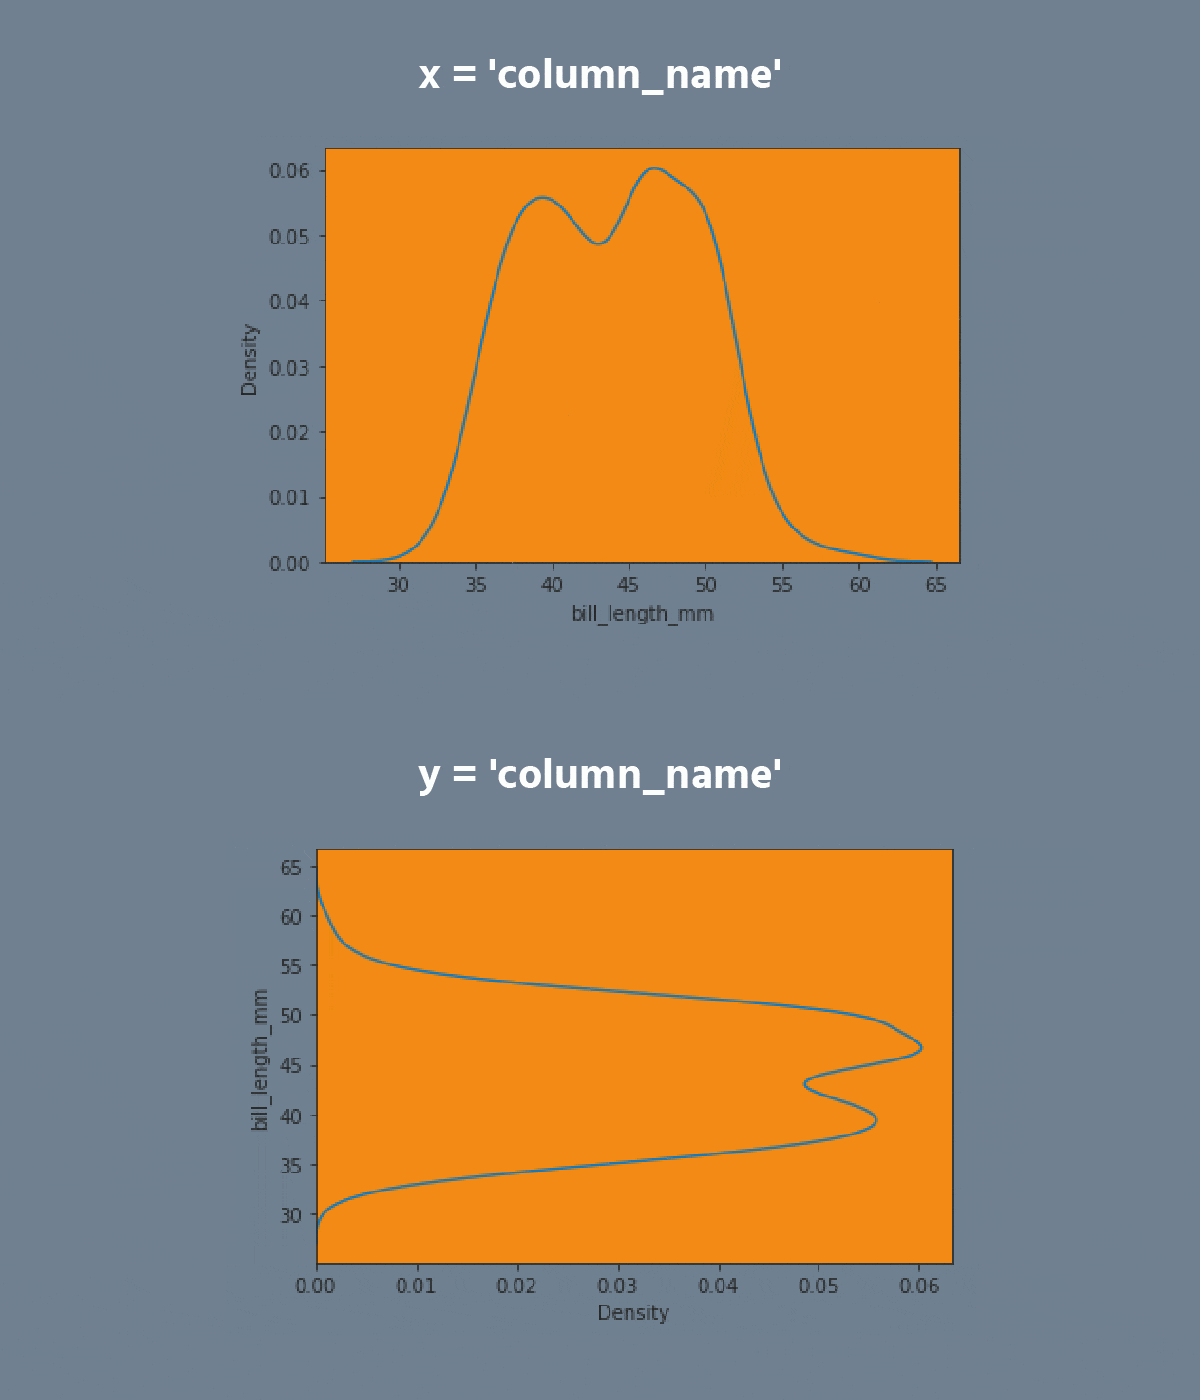
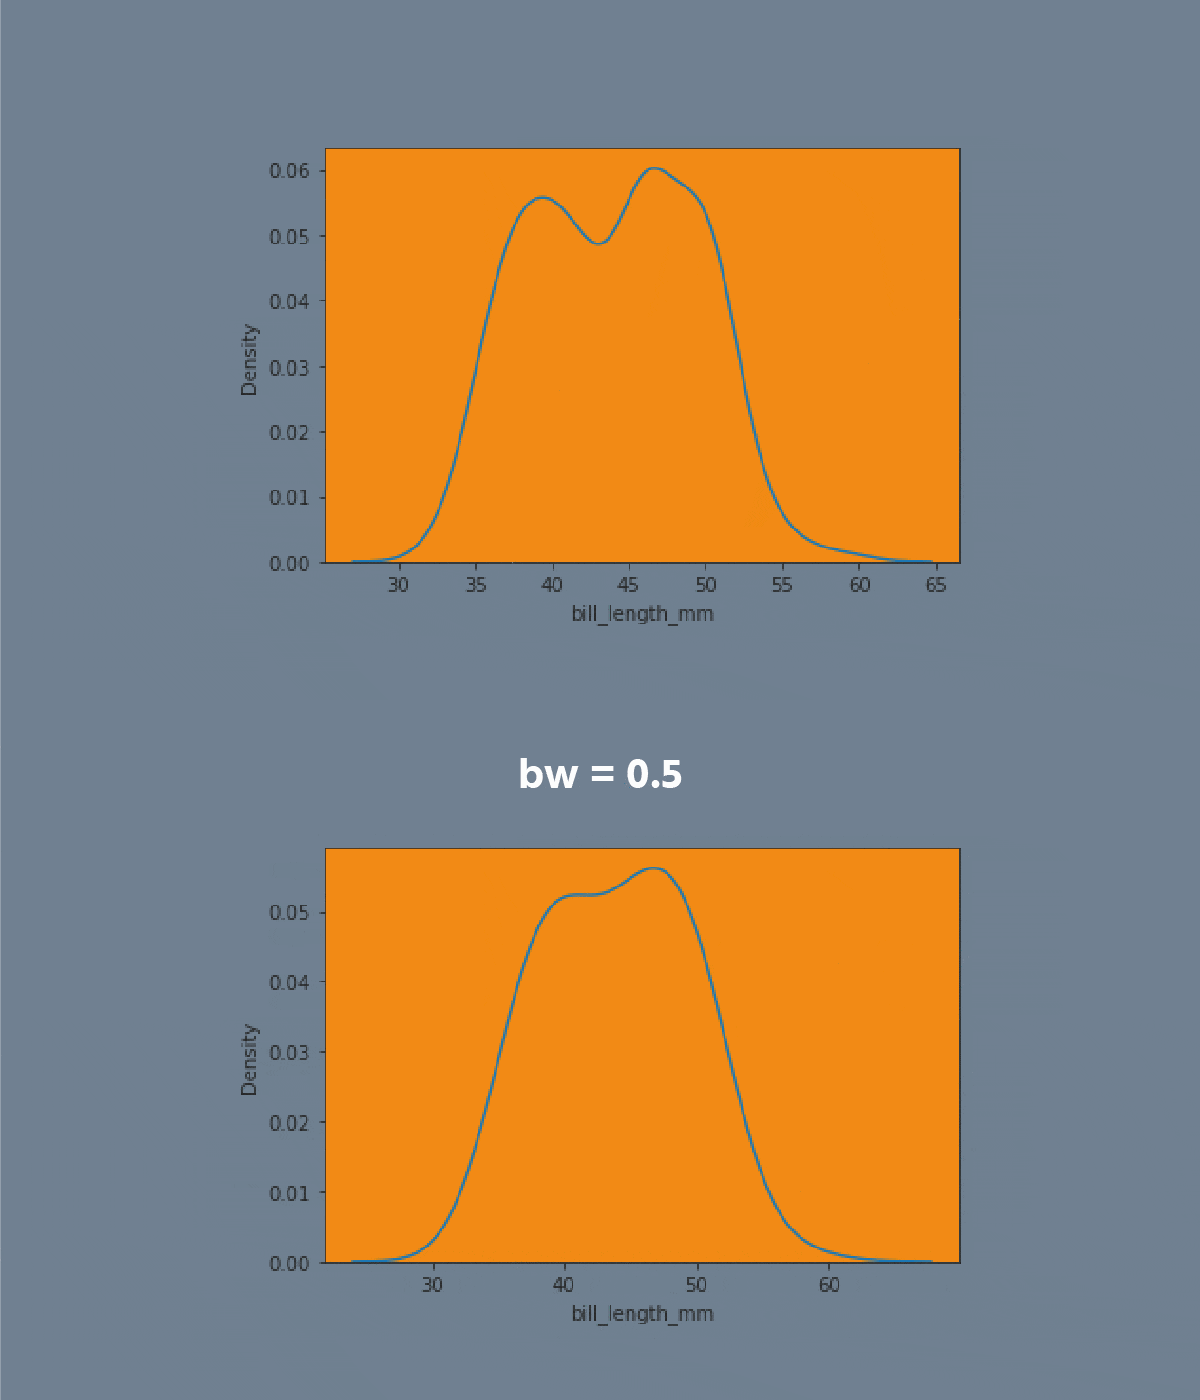
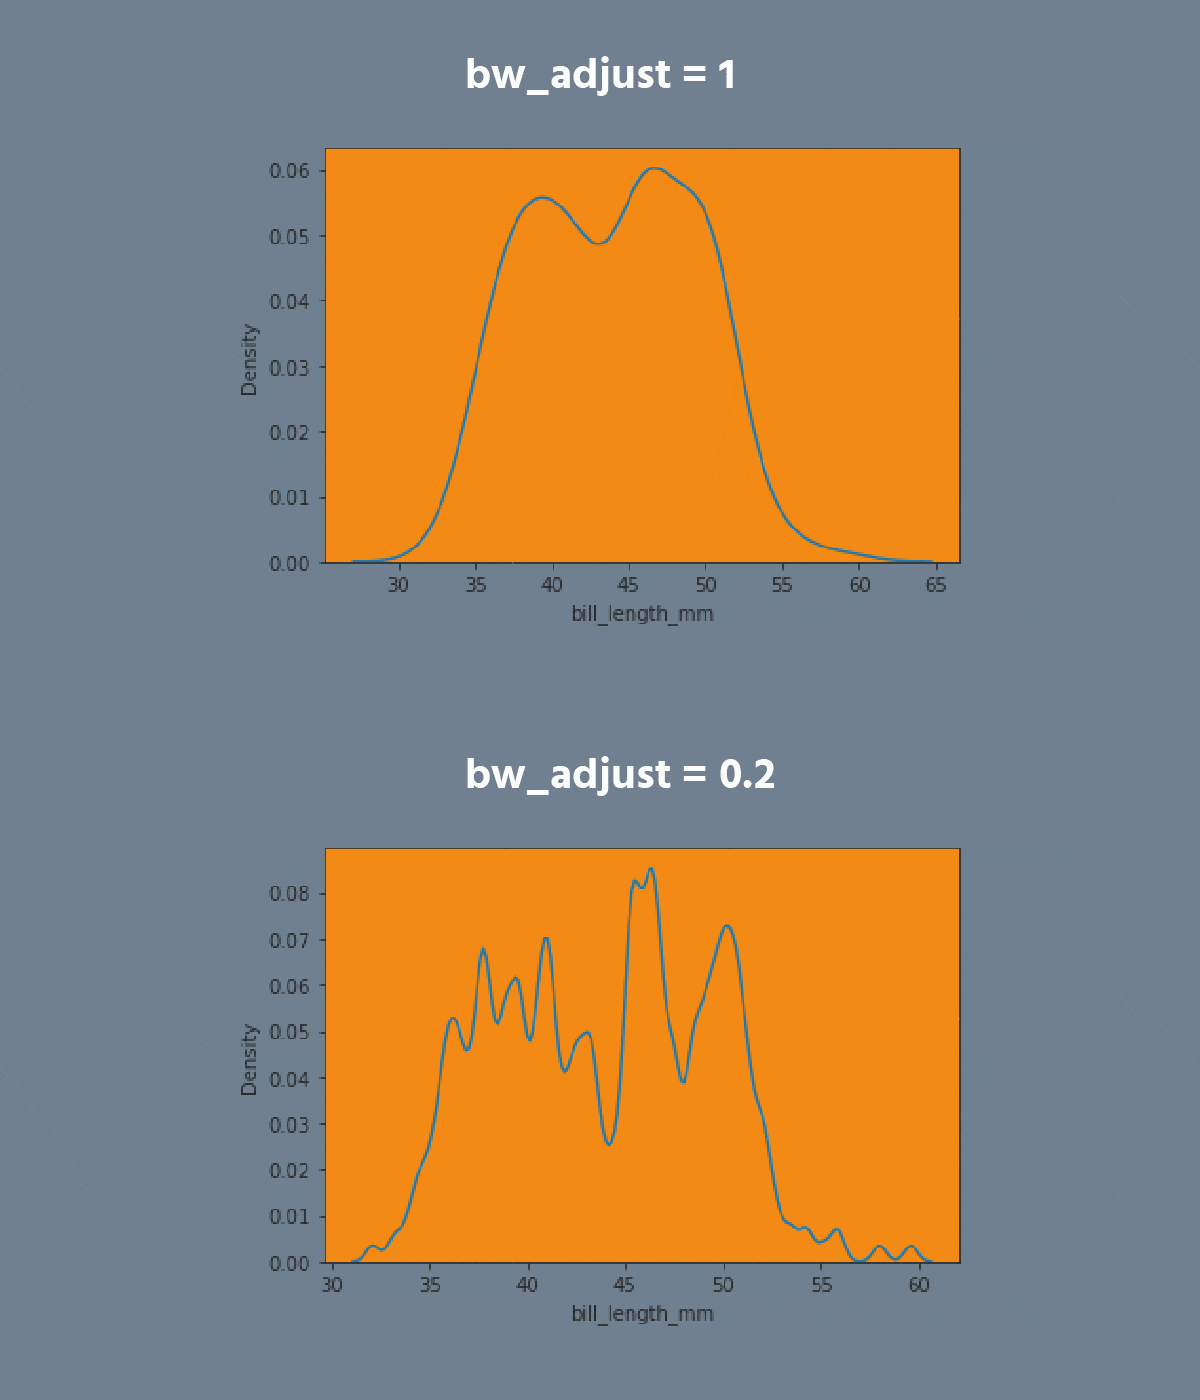
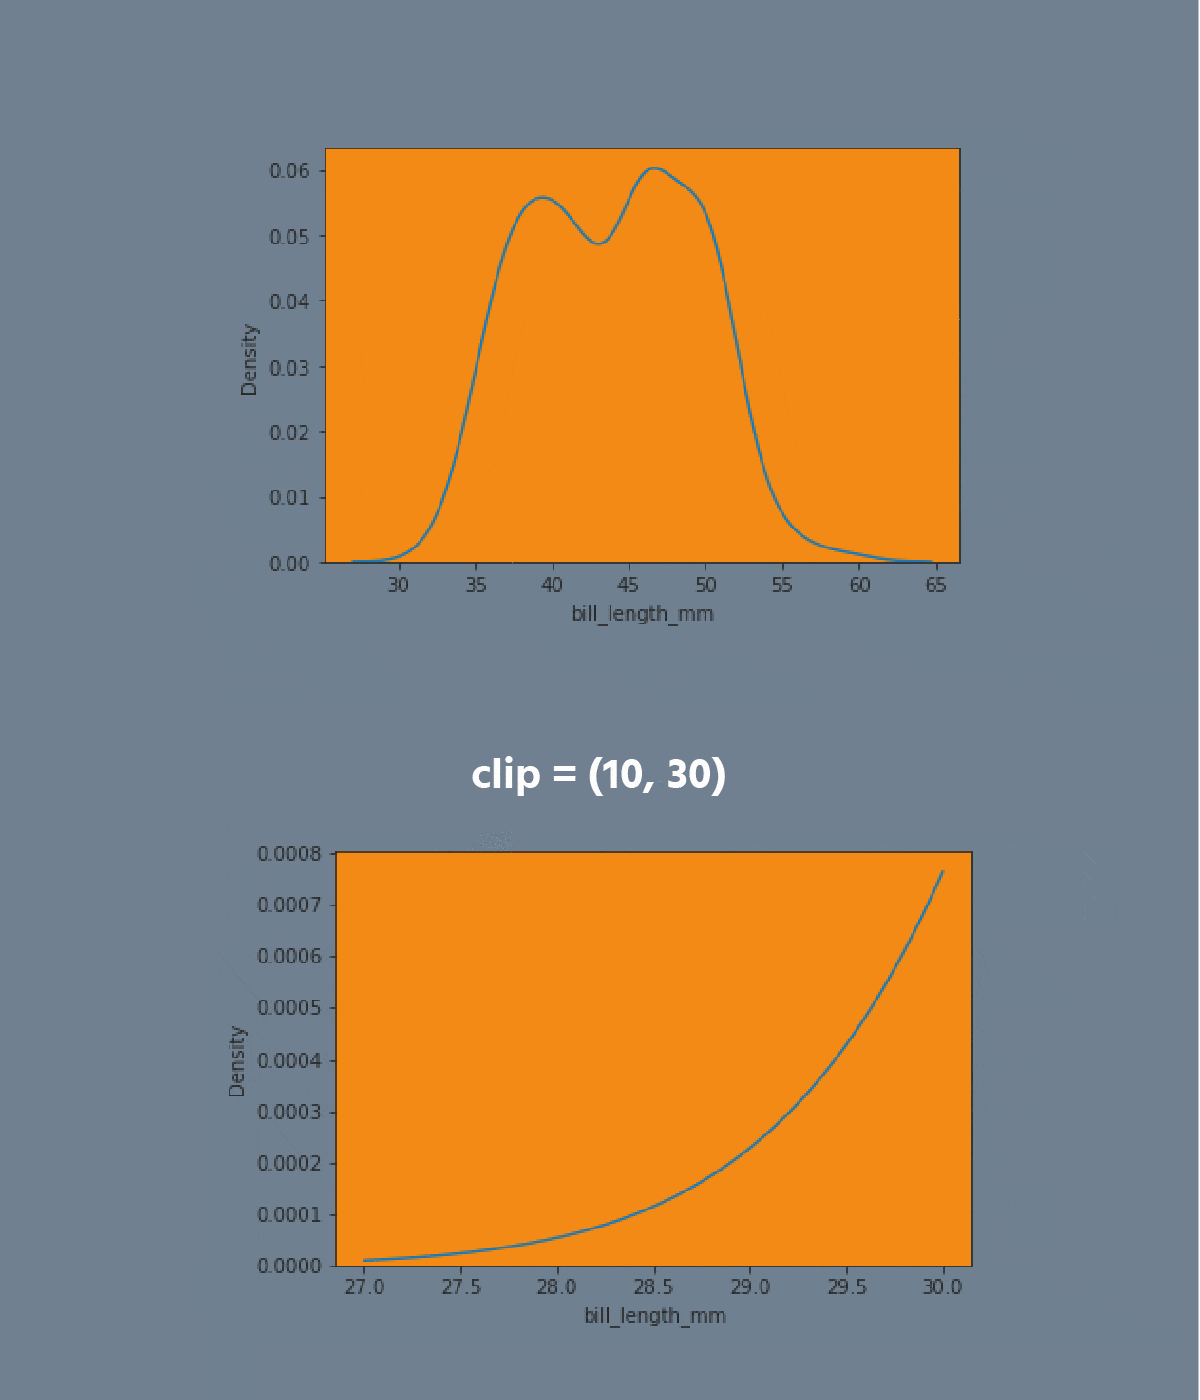
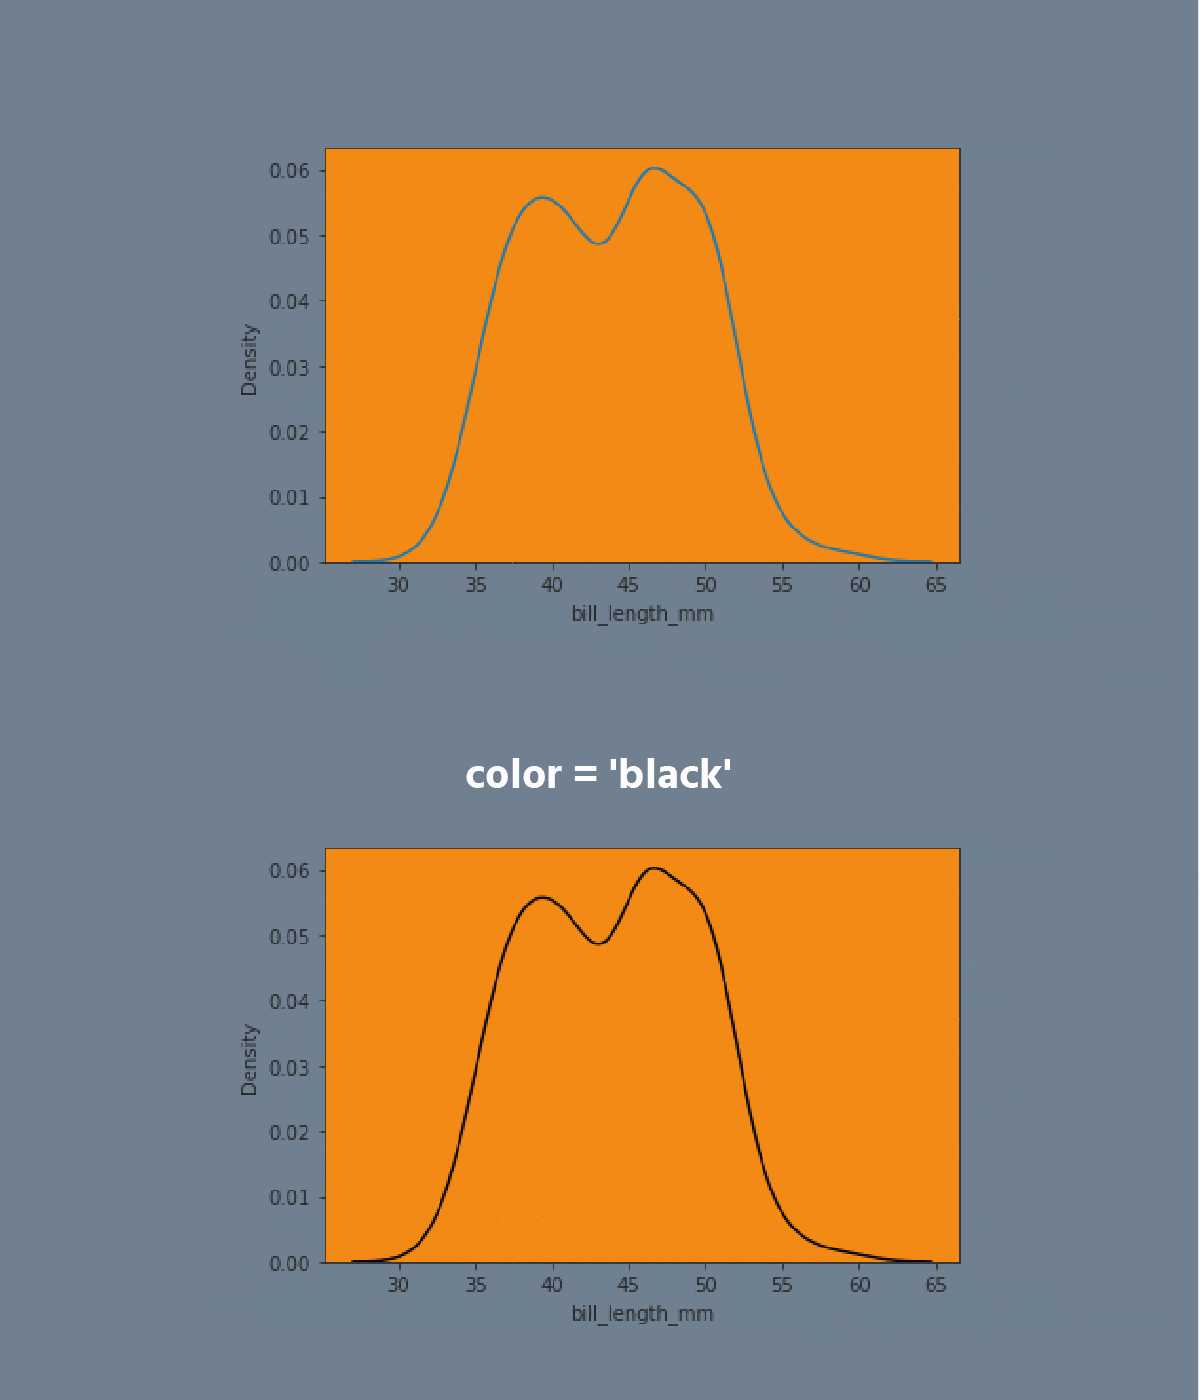
A kdeplot plot is a method for visualizing the distribution of observations in a dataset analogous to a histogram. KDE represents the data using a continuous probability density curve in one or more dimensions.




Uppgift
Swipe to start coding
- Create the kdeplot using the
seabornlibrary:
- Set the
xparameter equals the'max_temp'; - Set the
hueparameter equals the'month'; - Set the
multipleparameter equals the'stack'; - Disable the
legend; - Add the filling;
- Set the data;
- Display the plot.
Lösning
Var allt tydligt?
Tack för dina kommentarer!
Avsnitt 2. Kapitel 2
single
Fråga AI
Fråga AI

Fråga vad du vill eller prova någon av de föreslagna frågorna för att starta vårt samtal

Fantastiskt!
Completion betyg förbättrat till 4.35 Kdeplot
Svep för att visa menyn
A kdeplot plot is a method for visualizing the distribution of observations in a dataset analogous to a histogram. KDE represents the data using a continuous probability density curve in one or more dimensions.


Uppgift
Swipe to start coding
- Create the kdeplot using the
seabornlibrary:
- Set the
xparameter equals the'max_temp'; - Set the
hueparameter equals the'month'; - Set the
multipleparameter equals the'stack'; - Disable the
legend; - Add the filling;
- Set the data;
- Display the plot.
Lösning
Var allt tydligt?
Tack för dina kommentarer!
Avsnitt 2. Kapitel 2
single