Show Values As and Comparative Analysis
Veeg om het menu te tonen
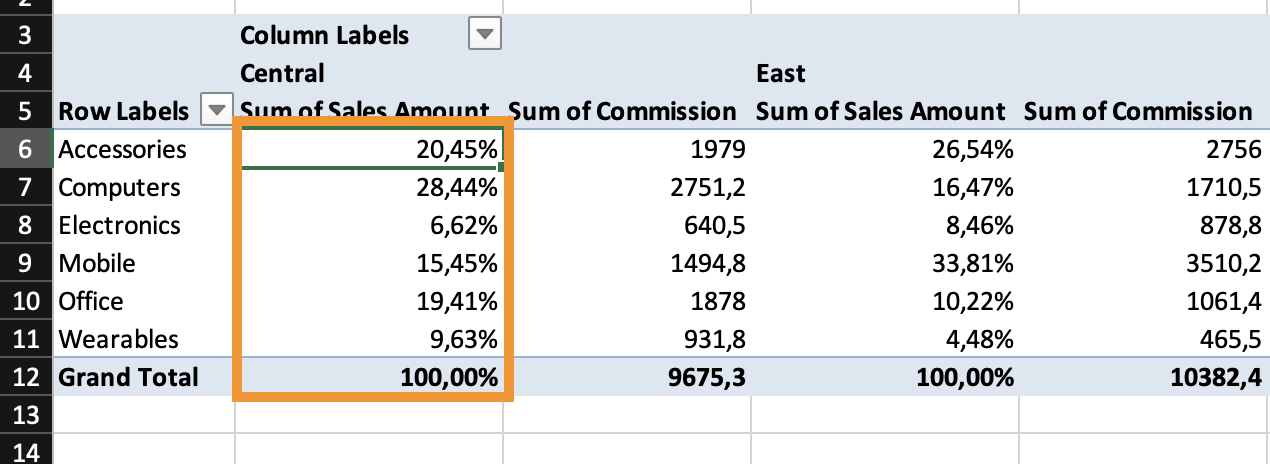
Pivot Tables can display values in different ways without changing the underlying calculation. Instead of showing raw totals, you can display percentages, differences, rankings, or running totals. In this chapter, you'll use Show Values As to compare performance.
By default, Pivot Tables display values as standard aggregations: Sum, Count, Average.
However, you can change how those values are presented.
Using "Show Values As"
To change how a value is displayed:
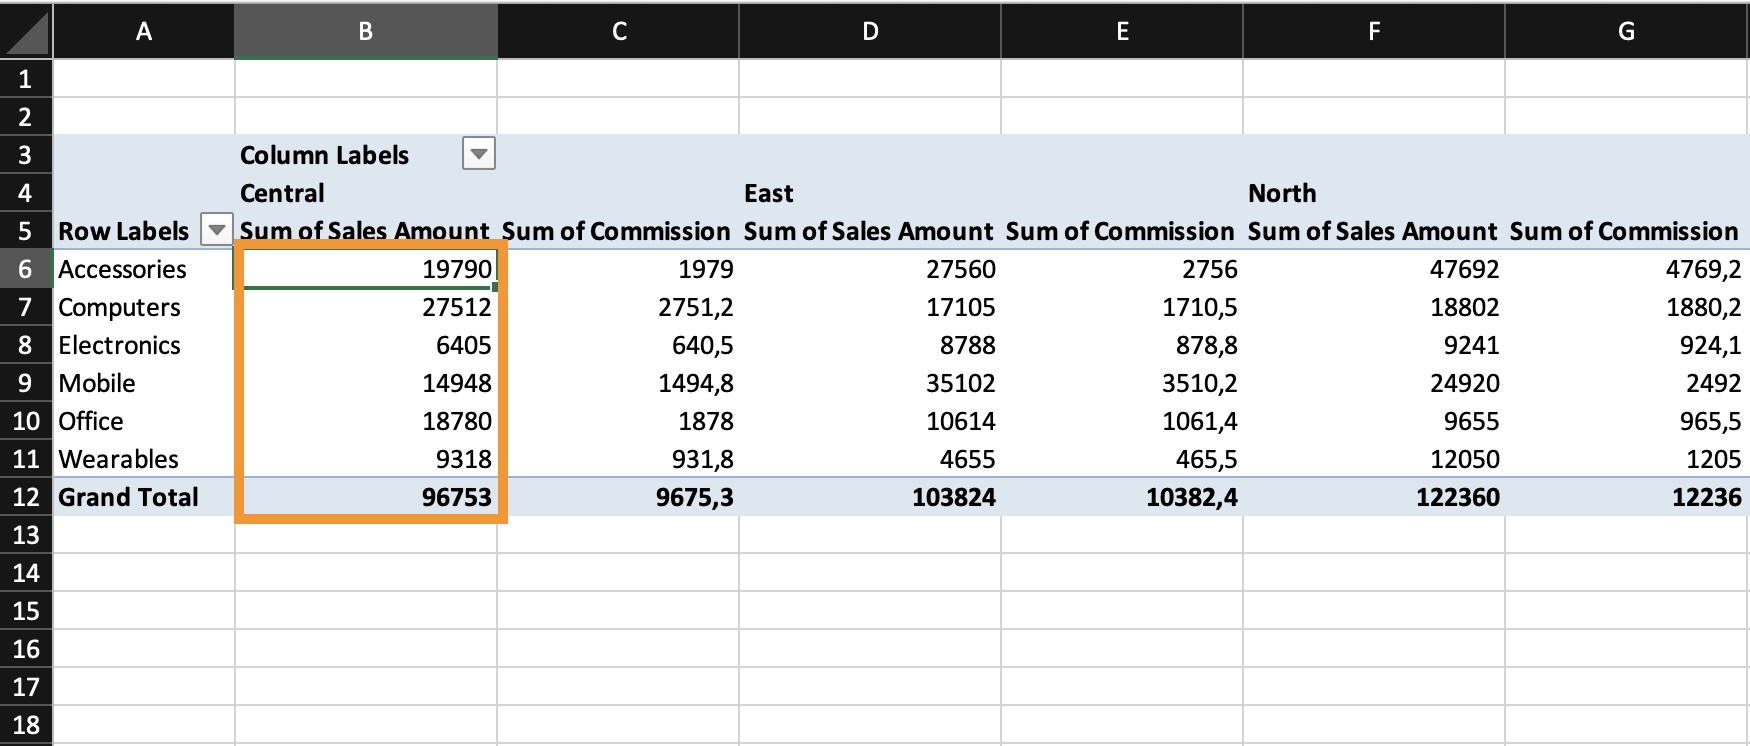
- Click any numeric cell in the Pivot Table;
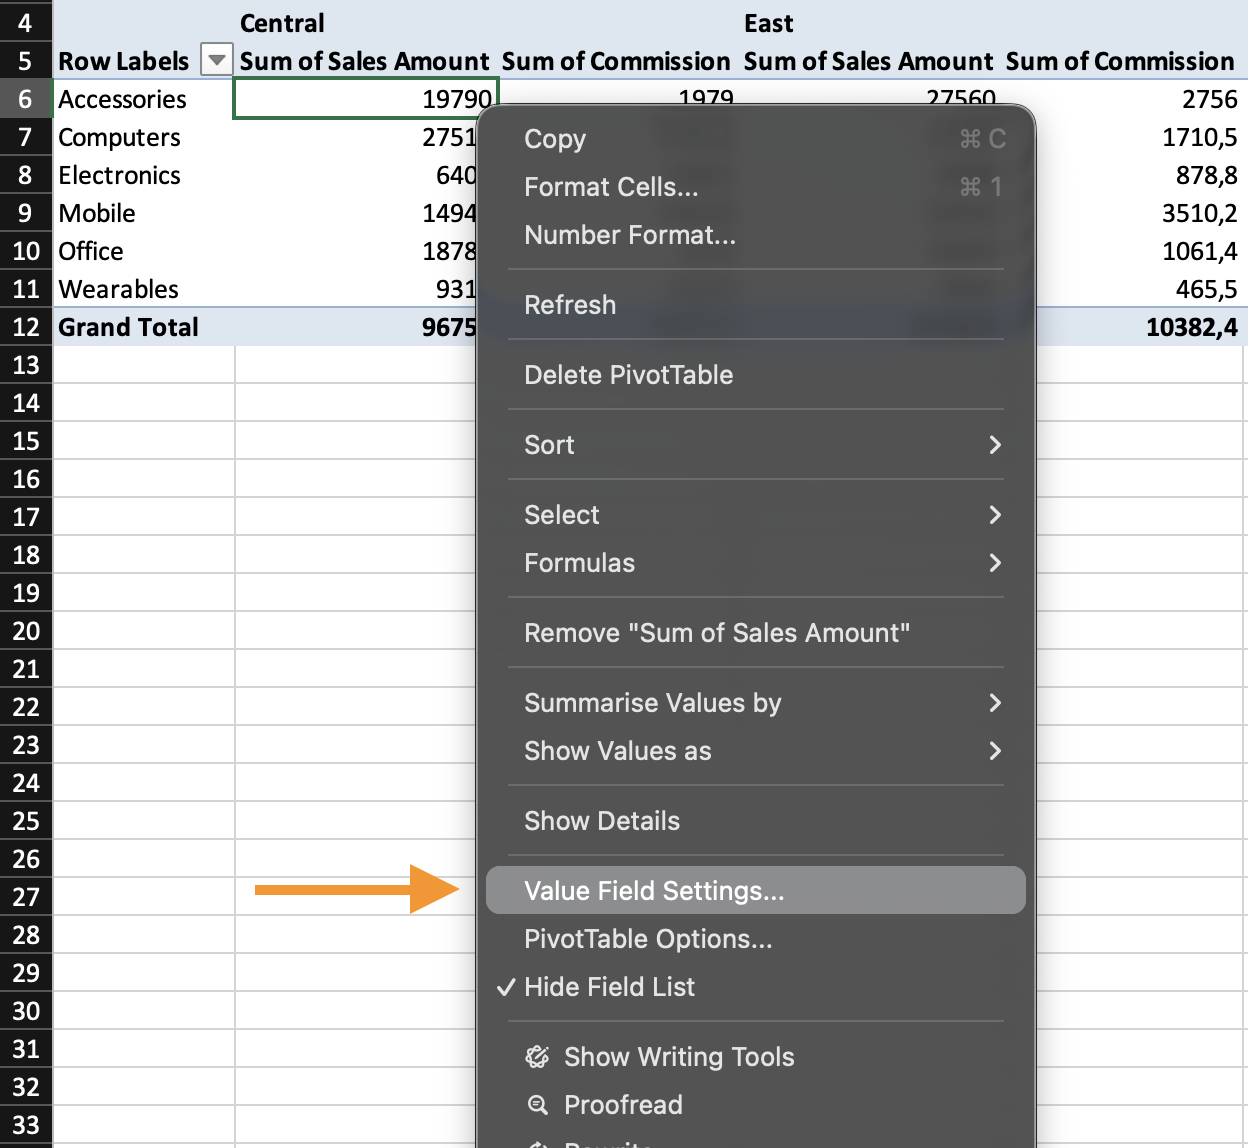
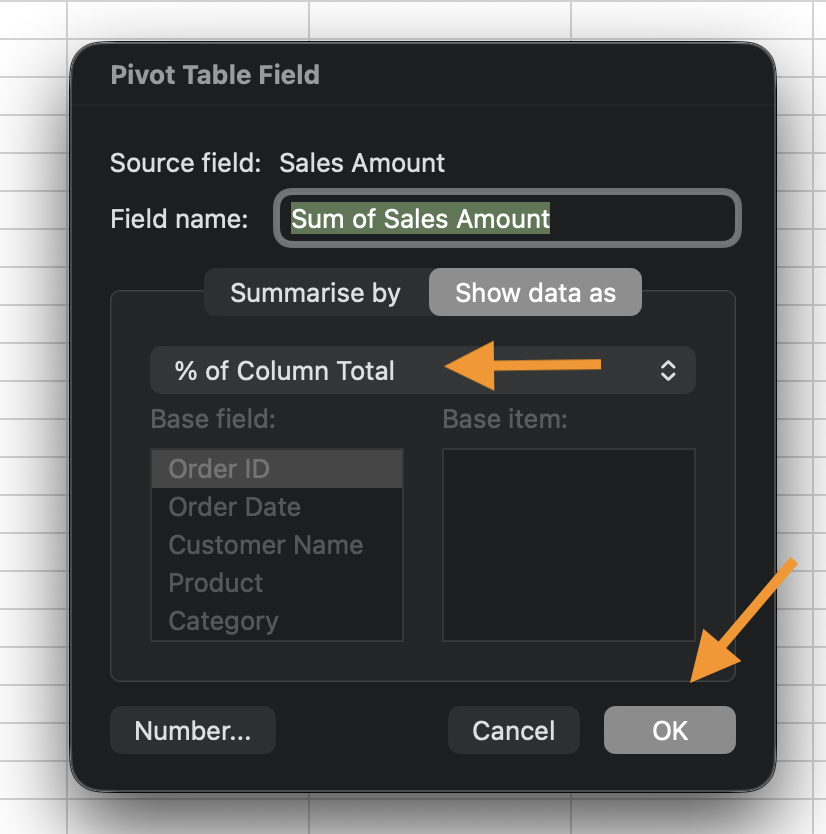
- Open Value Field Settings;
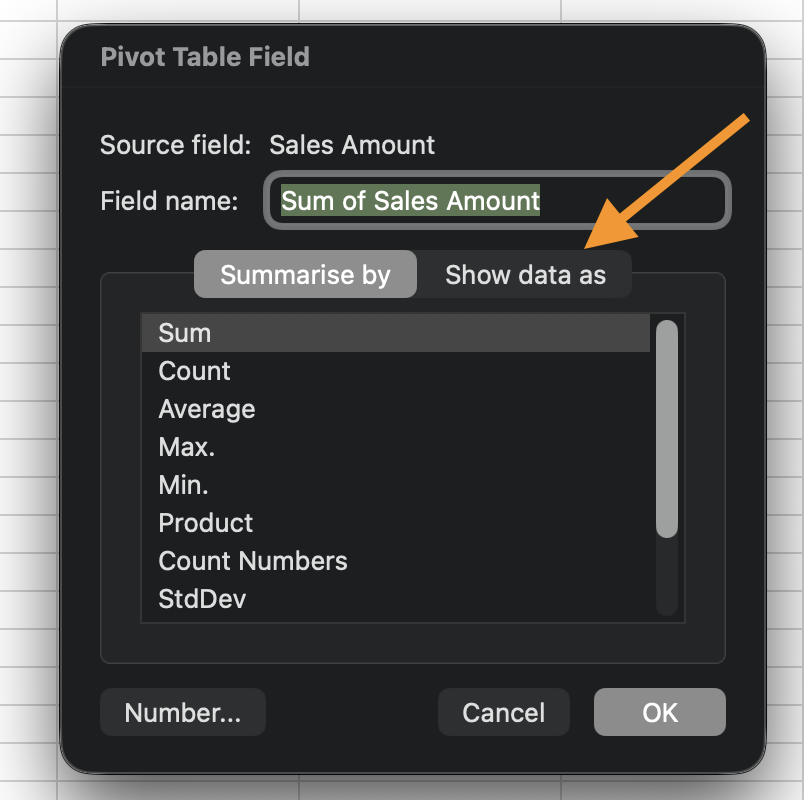
- Go to the Show Data As tab;
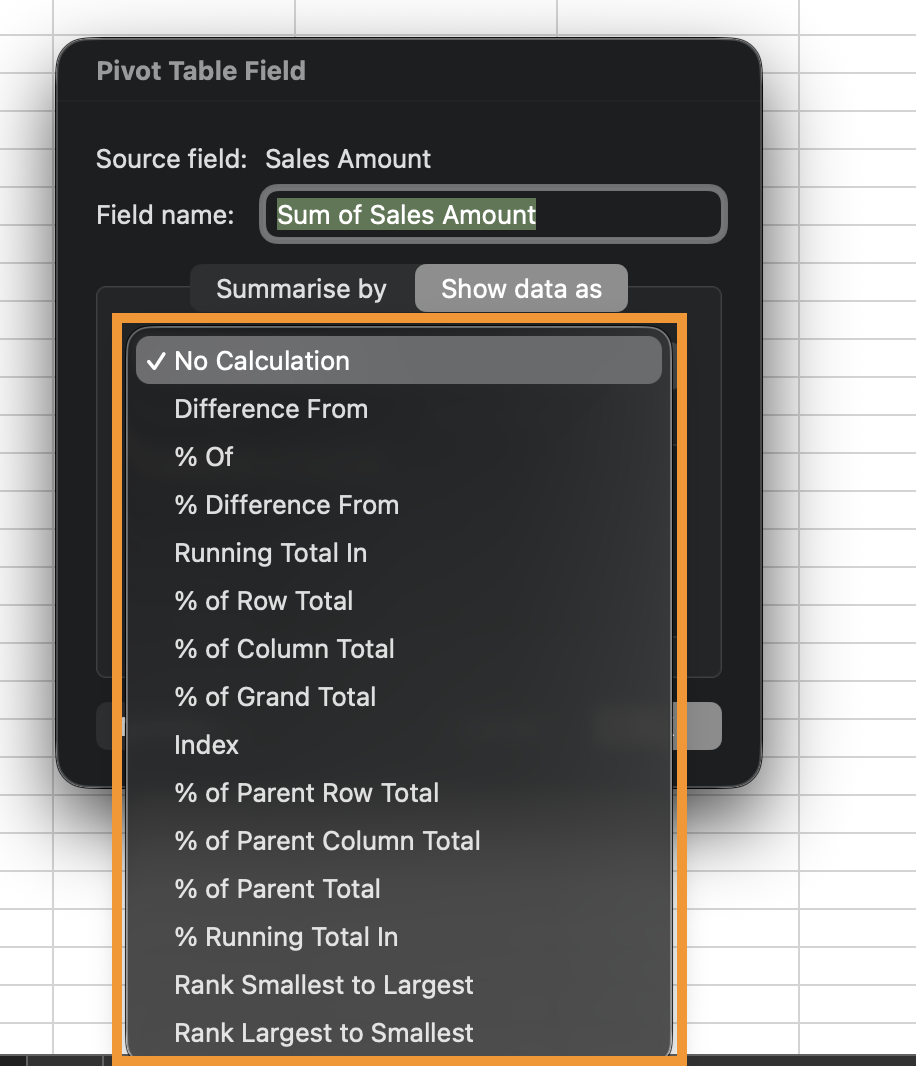
- Choose a calculation type.
This does not change the original aggregation. It changes only how the result is displayed.
Common Comparative Calculations
Task
Create a Pivot Table with:
- Rows: Category;
- Columns: Region;
- Values: Sum of Revenue.
Add Revenue again and set it to:
% of Grand Total.
Add Revenue again and set it to:
% of Row Total.
Bedankt voor je feedback!
Vraag AI

Vraag AI

Vraag wat u wilt of probeer een van de voorgestelde vragen om onze chat te starten.
