single
Introductie tot Seaborn
Veeg om het menu te tonen
Seaborn is een high-level visualisatiebibliotheek gebaseerd op matplotlib. Hier zijn de voordelen ten opzichte van matplotlib:
- eenvoudigere interface;
- een breed scala aan standaardstijlen en kleurpaletten;
- werkt goed met
pandasDataFrame; - een breed scala aan ingebouwde statistische functies.
Hier is een voorbeeld van een grafiek gemaakt met seaborn in slechts één regel code:
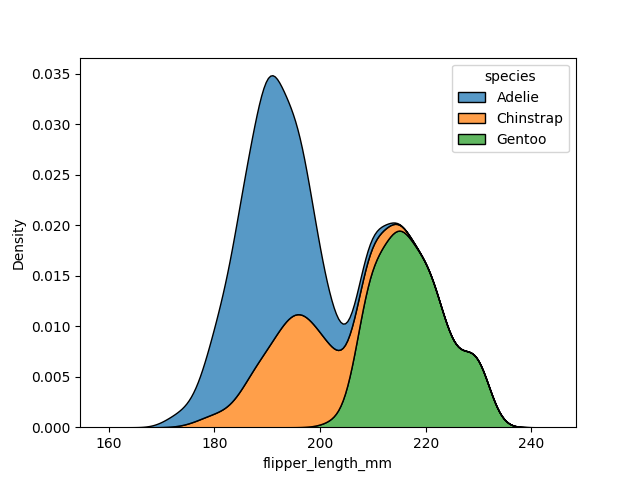
Blijkbaar kan alles wat je met seaborn kunt bereiken ook met matplotlib worden gedaan, maar dit kost vaak meer tijd en moeite.
Echter, aangezien matplotlib een vrij laag-niveau bibliotheek is in vergelijking, biedt het meer flexibiliteit voor uw grafieken. Dus als u een vrij unieke grafiek met veel aanpassingen moet maken, blijft matplotlib de beste keuze.
Veeg om te beginnen met coderen
Importeer de seaborn-bibliotheek met het alias sns.
Oplossing
Bedankt voor je feedback!
single
Vraag AI
Vraag AI

Vraag wat u wilt of probeer een van de voorgestelde vragen om onze chat te starten.
