Seksjon 3. Kapittel 6
single
Challenge
Sveip for å vise menyen
In this challenge, you are given the good old housing dataset, but this time only with the 'age' feature.
1234import pandas as pd df = pd.read_csv('https://codefinity-content-media.s3.eu-west-1.amazonaws.com/b22d1166-efda-45e8-979e-6c3ecfc566fc/houses_poly.csv') print(df.head())
Let's build a scatterplot of this data.
1234567import pandas as pd import matplotlib.pyplot as plt df = pd.read_csv('https://codefinity-content-media.s3.eu-west-1.amazonaws.com/b22d1166-efda-45e8-979e-6c3ecfc566fc/houses_poly.csv') X = df['age'] y = df['price'] plt.scatter(X, y, alpha=0.4)
Fitting a straight line to this data may not be a great choice.
The price gets higher for either brand-new or really old houses.
Fitting a parabola looks like a better choice. And that's what you will do in this challenge.
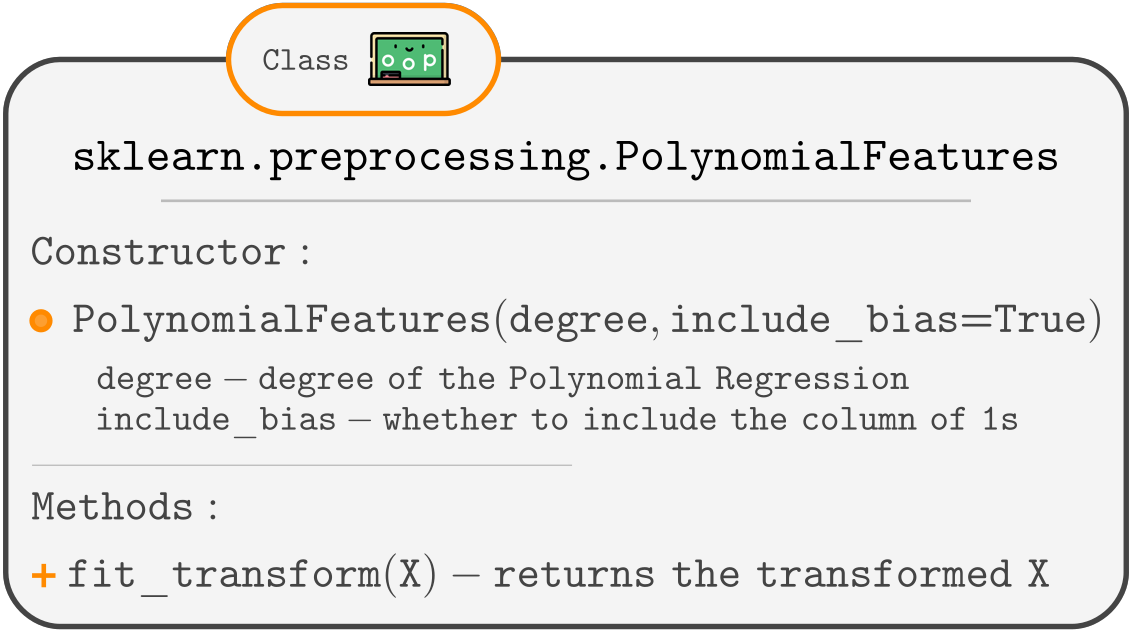
The task is to build a Polynomial Regression of degree 2 using a pipeline, as was shown in a previous chapter.
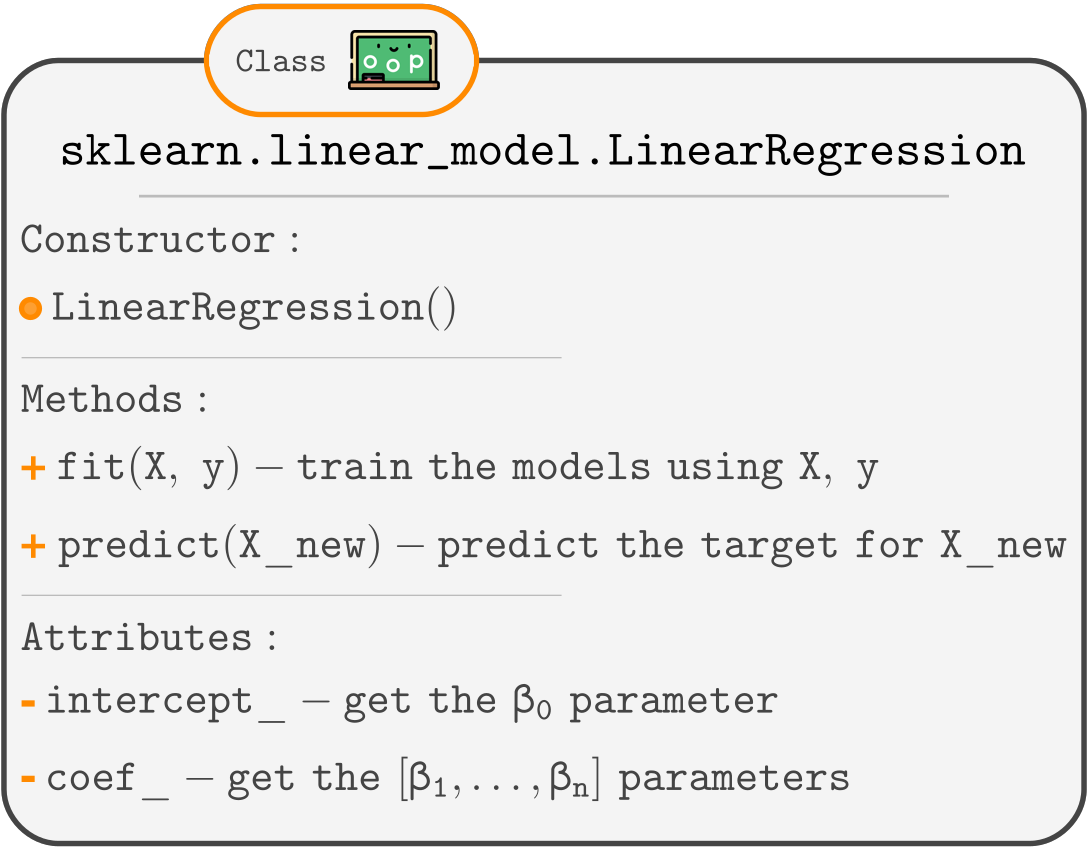
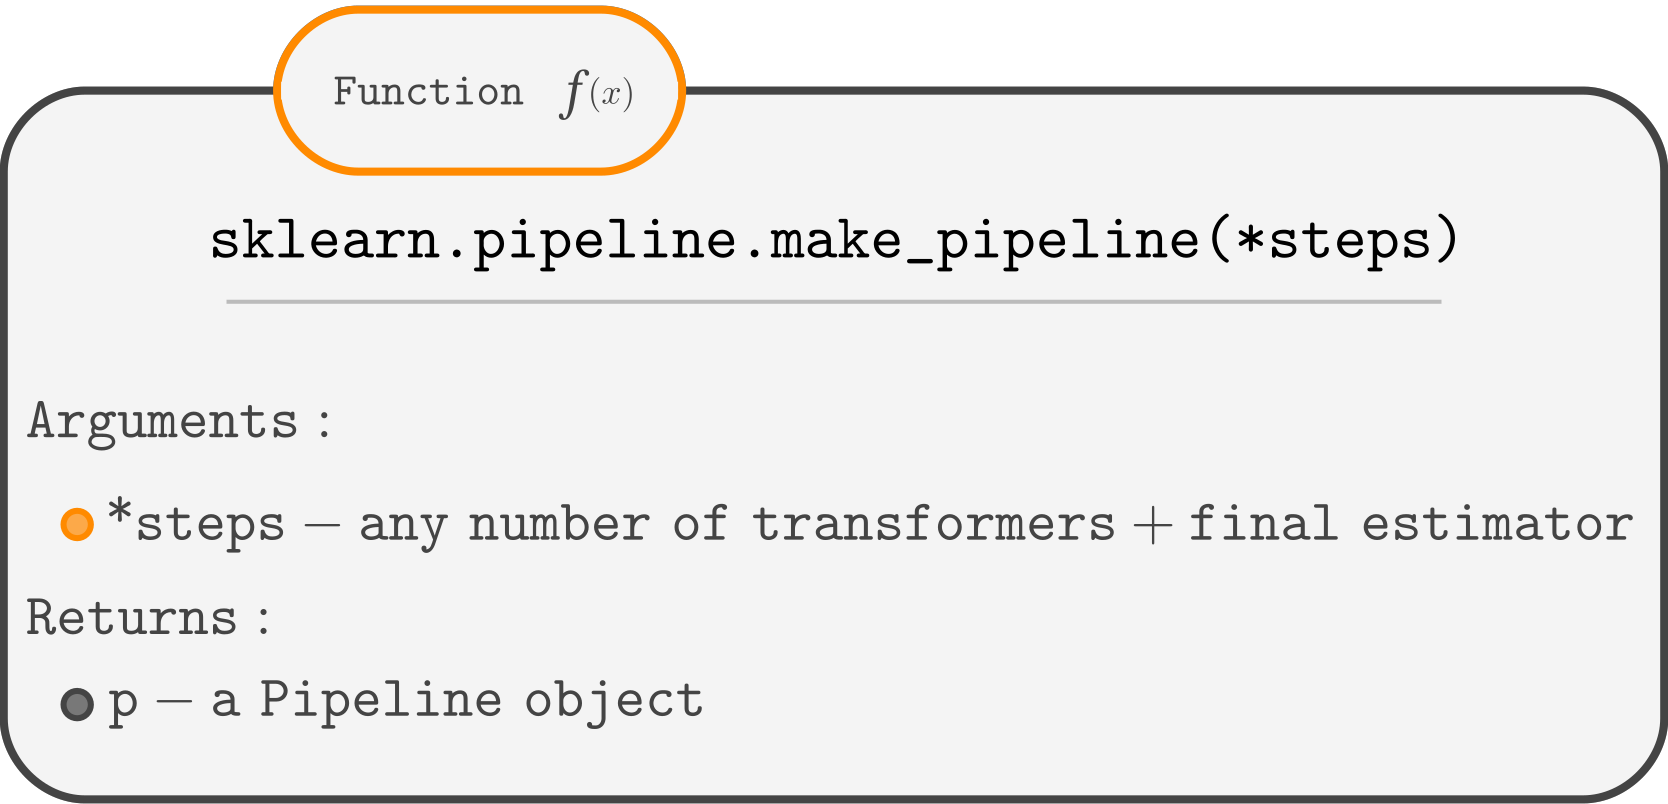
Here is a list of the classes and functions from sklearn that you will need.
Oppgave
Sveip for å begynne å kode
- Create a model using the
make_pipelinefunction.
As function arguments, pass the instances of classes that:- adds polynomial features of a degree
n(don't forget to set theinclude_biastoFalse). - performs Linear Regression.
- adds polynomial features of a degree
- Train the model.
- Predict the target for
X_new.
Løsning
Alt var klart?
Takk for tilbakemeldingene dine!
Seksjon 3. Kapittel 6
single
Spør AI
Spør AI

Spør om hva du vil, eller prøv ett av de foreslåtte spørsmålene for å starte chatten vår
