single
Introduksjon til Seaborn
Sveip for å vise menyen
Seaborn er et høynivå visualiseringsbibliotek basert på matplotlib. Her er noen fordeler sammenlignet med matplotlib:
- enklere grensesnitt;
- et bredt utvalg av standardstiler og fargepaletter;
- fungerer godt med
pandasDataFrame; - et bredt utvalg av innebygde statistiske funksjoner.
Her er et eksempel på et diagram laget med seaborn med kun én kodelinje:
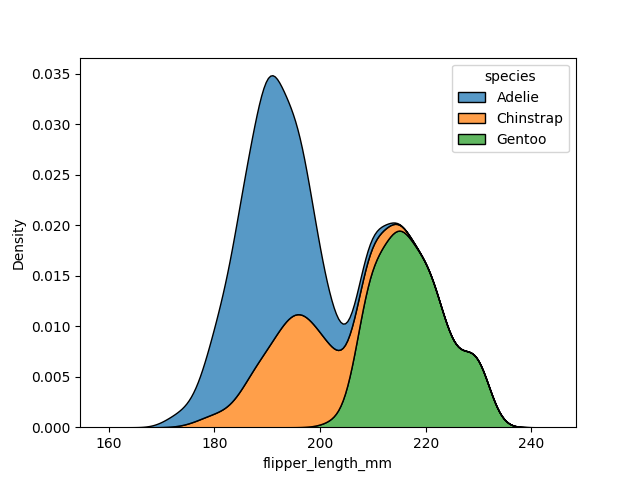
Tilsynelatende kan alt du kan oppnå med seaborn også gjøres med matplotlib, men det kan ofte kreve mer tid og innsats.
Likevel, siden matplotlib er et relativt lavnivå-bibliotek i sammenligning, gir det mer fleksibilitet for diagrammene dine. Hvis du trenger å lage et unikt diagram med mange tilpasninger, er matplotlib fortsatt det beste valget.
Sveip for å begynne å kode
Importer seaborn-biblioteket med aliaset sns.
Løsning
Takk for tilbakemeldingene dine!
single
Spør AI
Spør AI

Spør om hva du vil, eller prøv ett av de foreslåtte spørsmålene for å starte chatten vår
