Notice: This page requires JavaScript to function properly.
Please enable JavaScript in your browser settings or update your browser.
学ぶ Basic Aggregations and Value Settings | ピボットテーブルの基礎
レポートとダッシュボードのためのExcelピボットテーブル

Basic Aggregations and Value Settings

メニューを表示するにはスワイプしてください

When you add a field to the Values area, Excel applies an aggregation automatically. In this chapter, you'll learn how these aggregations work and how to change them to get the result you actually need.

In a Pivot Table, the Values area controls calculations. When a numeric field is added, Excel usually applies Sum by default. This default behavior is not always correct. The same data can be summarized in different ways depending on the question you want to answer.

Common aggregation options include:

  • Sum: adds all values;
  • Count: counts records;
  • Average: calculates the mean value;
  • Min / Max: shows smallest or largest value.

To change how a field is calculated:

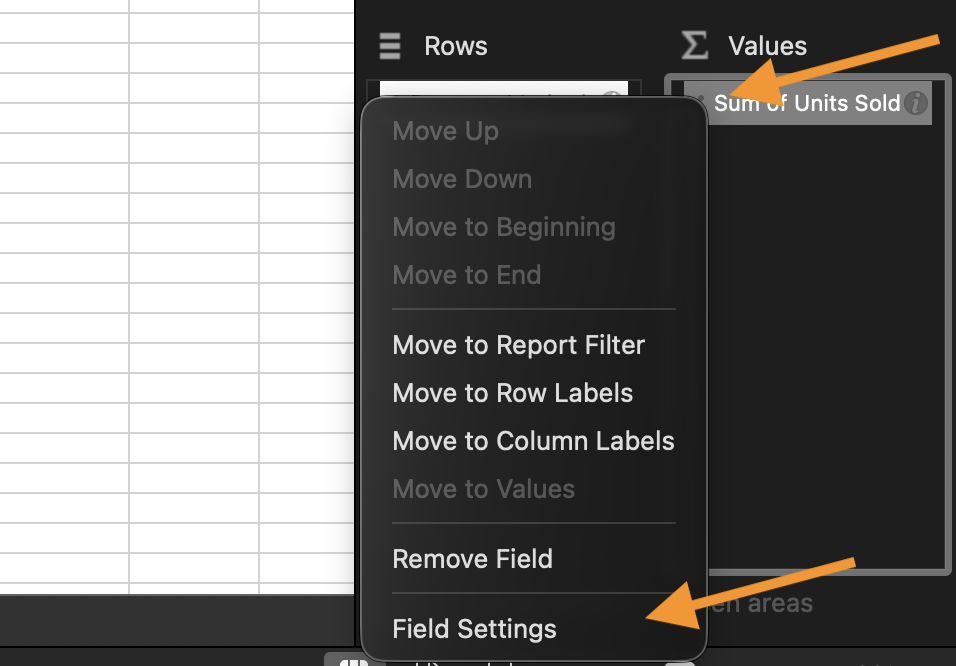
  • Click the dropdown next to the field in the Values area;
  • Open Value Field Settings;
step 1
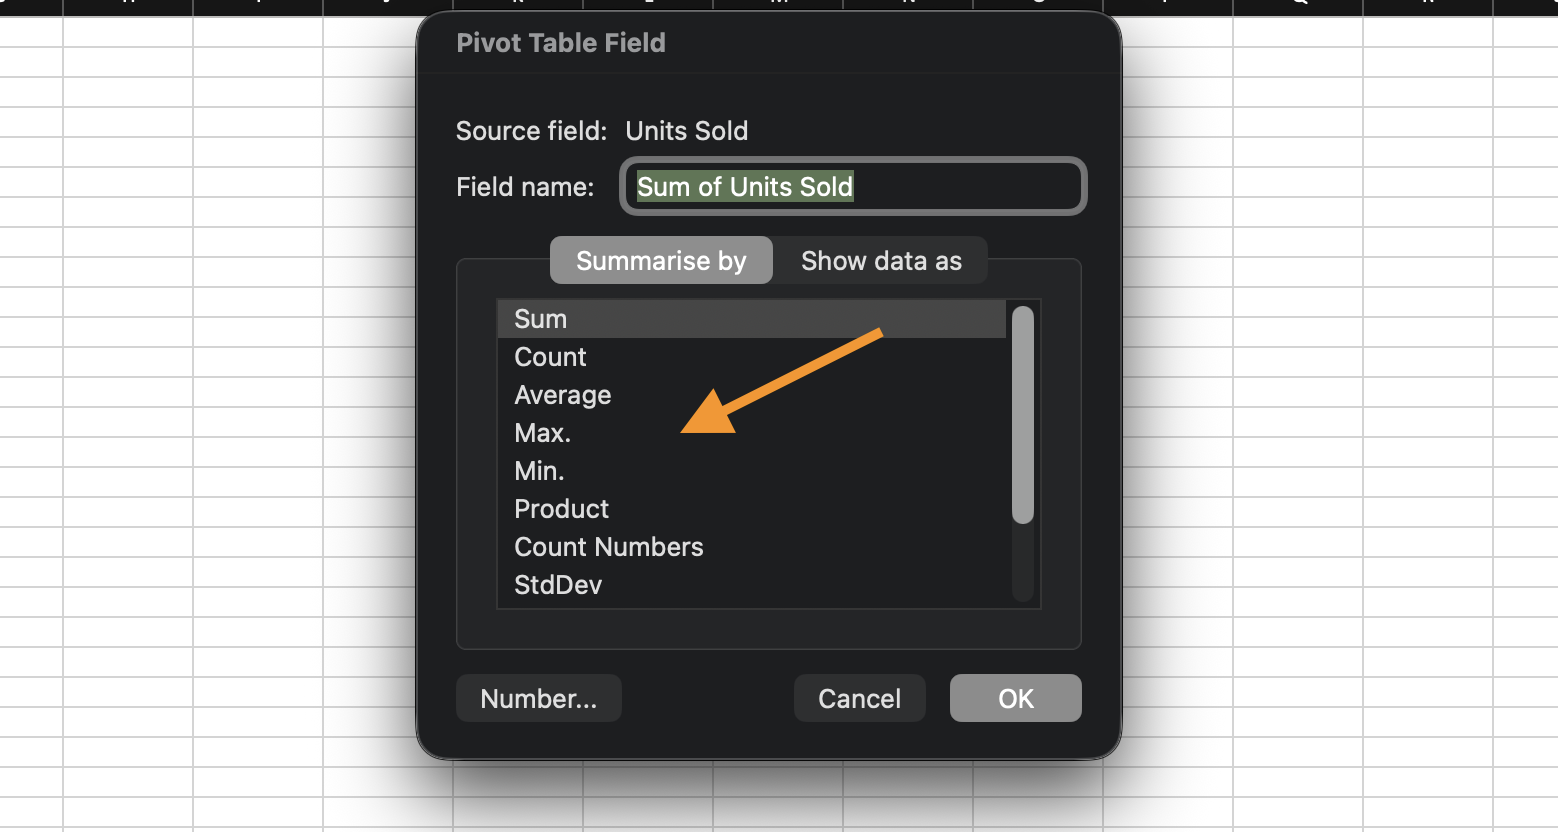
  • Choose the required aggregation.
step 2

Pivot Tables also allow multiple value fields at the same time.

You can add the same field more than once and apply different calculations to each version. This makes it possible to compare totals, counts, and averages in a single report.

Task

Adjust the aggregation used in a Pivot Table.

Do the following:

  • Create or reuse a Pivot Table;
  • Place Category in Rows;
  • Place Sales in Values;
  • Change the aggregation from Sum to Average;
  • Add Sales to Values a second time and keep it as Sum.
すべて明確でしたか?

どのように改善できますか?

フィードバックありがとうございます!

セクション 1.  3

AIに質問する

expand

AIに質問する

ChatGPT

何でも質問するか、提案された質問の1つを試してチャットを始めてください

Basic Aggregations and Value Settings

When you add a field to the Values area, Excel applies an aggregation automatically. In this chapter, you'll learn how these aggregations work and how to change them to get the result you actually need.

In a Pivot Table, the Values area controls calculations. When a numeric field is added, Excel usually applies Sum by default. This default behavior is not always correct. The same data can be summarized in different ways depending on the question you want to answer.

Common aggregation options include:

  • Sum: adds all values;
  • Count: counts records;
  • Average: calculates the mean value;
  • Min / Max: shows smallest or largest value.

To change how a field is calculated:

  • Click the dropdown next to the field in the Values area;
  • Open Value Field Settings;
step 1
  • Choose the required aggregation.
step 2

Pivot Tables also allow multiple value fields at the same time.

You can add the same field more than once and apply different calculations to each version. This makes it possible to compare totals, counts, and averages in a single report.

Task

Adjust the aggregation used in a Pivot Table.

Do the following:

  • Create or reuse a Pivot Table;
  • Place Category in Rows;
  • Place Sales in Values;
  • Change the aggregation from Sum to Average;
  • Add Sales to Values a second time and keep it as Sum.
すべて明確でしたか?

どのように改善できますか?

フィードバックありがとうございます!

セクション 1.  3
some-alt