Challenge
In this challenge, you are given the good old housing dataset, but this time only with the 'age' feature.
1234import pandas as pd df = pd.read_csv('https://codefinity-content-media.s3.eu-west-1.amazonaws.com/b22d1166-efda-45e8-979e-6c3ecfc566fc/houses_poly.csv') print(df.head())
Let's build a scatterplot of this data.
1234567import pandas as pd import matplotlib.pyplot as plt df = pd.read_csv('https://codefinity-content-media.s3.eu-west-1.amazonaws.com/b22d1166-efda-45e8-979e-6c3ecfc566fc/houses_poly.csv') X = df['age'] y = df['price'] plt.scatter(X, y, alpha=0.4)
Fitting a straight line to this data may not be a great choice.
The price gets higher for either brand-new or really old houses.
Fitting a parabola looks like a better choice. And that's what you will do in this challenge.
The task is to build a Polynomial Regression of degree 2 using a pipeline, as was shown in a previous chapter.
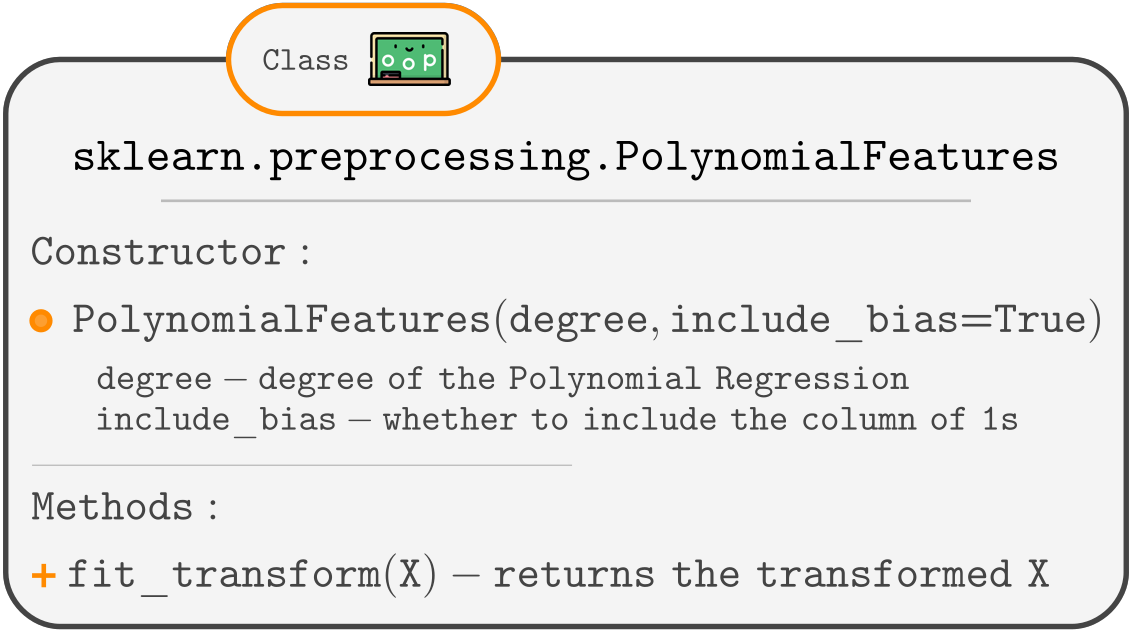
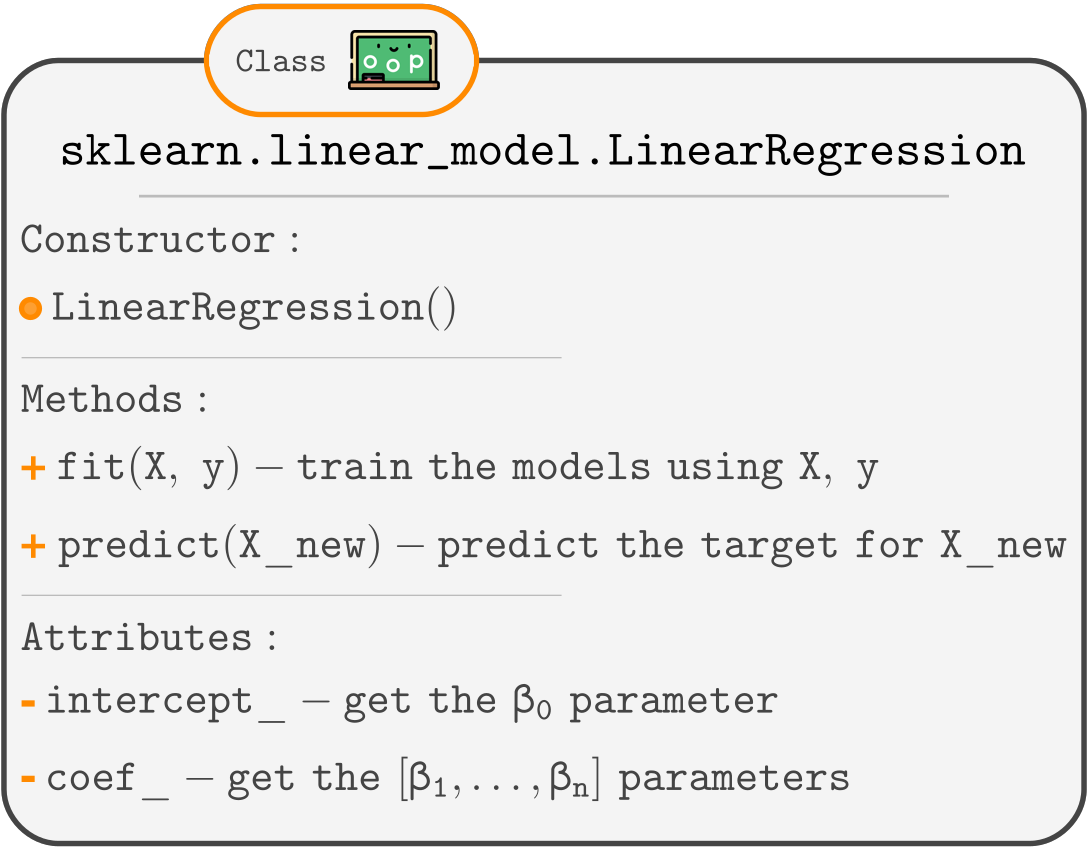
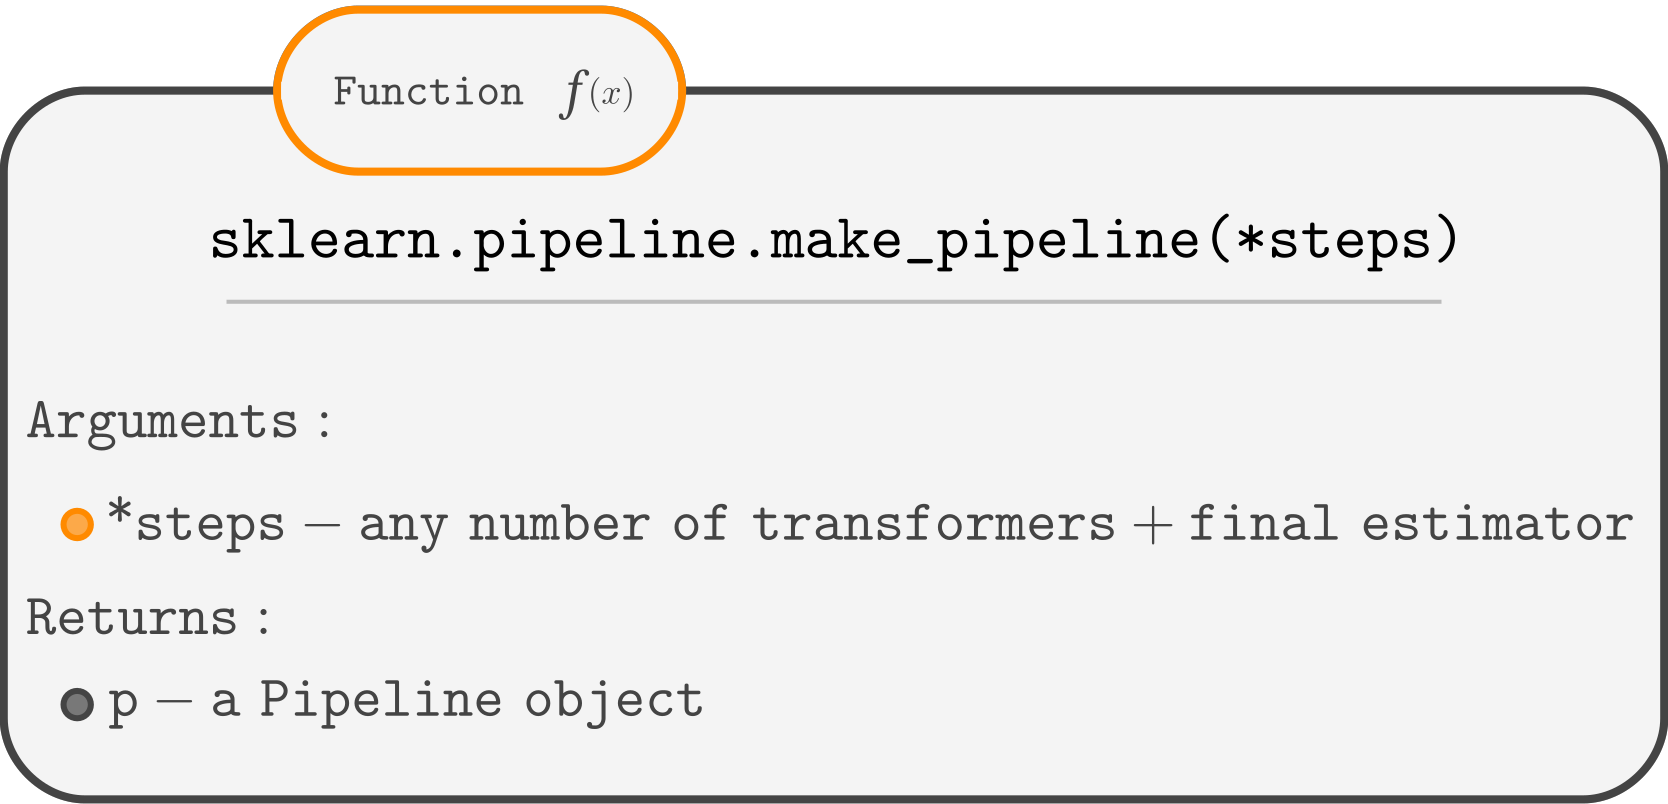
Here is a list of the classes and functions from sklearn that you will need.
フィードバックありがとうございます!

single
Challenge
メニューを表示するにはスワイプしてください
In this challenge, you are given the good old housing dataset, but this time only with the 'age' feature.
1234import pandas as pd df = pd.read_csv('https://codefinity-content-media.s3.eu-west-1.amazonaws.com/b22d1166-efda-45e8-979e-6c3ecfc566fc/houses_poly.csv') print(df.head())
Let's build a scatterplot of this data.
1234567import pandas as pd import matplotlib.pyplot as plt df = pd.read_csv('https://codefinity-content-media.s3.eu-west-1.amazonaws.com/b22d1166-efda-45e8-979e-6c3ecfc566fc/houses_poly.csv') X = df['age'] y = df['price'] plt.scatter(X, y, alpha=0.4)
Fitting a straight line to this data may not be a great choice.
The price gets higher for either brand-new or really old houses.
Fitting a parabola looks like a better choice. And that's what you will do in this challenge.
The task is to build a Polynomial Regression of degree 2 using a pipeline, as was shown in a previous chapter.
Here is a list of the classes and functions from sklearn that you will need.
スワイプしてコーディングを開始
- Create a model using the
make_pipelinefunction.
As function arguments, pass the instances of classes that:- adds polynomial features of a degree
n(don't forget to set theinclude_biastoFalse). - performs Linear Regression.
- adds polynomial features of a degree
- Train the model.
- Predict the target for
X_new.
解答
 実践的な練習のためにデスクトップに切り替える下記のオプションのいずれかを利用して、現在の場所から続行する
フィードバックありがとうございます!
single
AIに質問する

AIに質問する

何でも質問するか、提案された質問の1つを試してチャットを始めてください
