セクション 1. 章 17
single
seaborn
メニューを表示するにはスワイプしてください
Seaborn is a high-level plotting library based on matplotlib. Let's have a look at its advantages in comparison to matplotlib:
- simpler interface;
- a wide range of default styles and color palettes;
- works well with
pandasDataFrame; - a wide range of built-in statistical functions.
Here is an example of a plot created using seaborn with just one line of code:
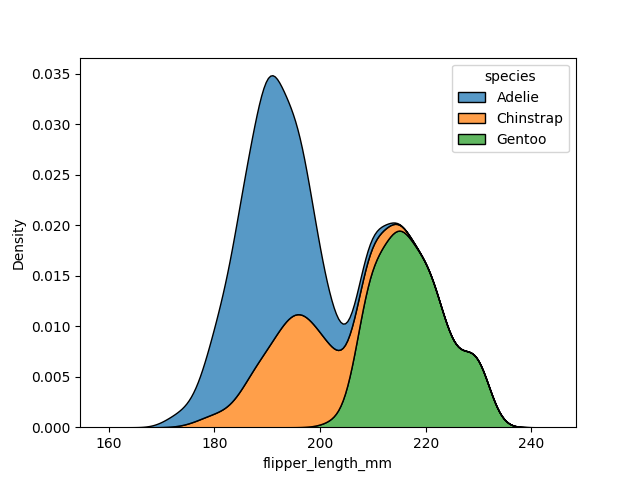
Note
Apparently, everything you can accomplish using seaborn can be also done with matplotlib, yet it may often take more time and effort.
However, matplotlib being a rather low-level library in comparison, offers more flexibility for your plots, so if you need to create a rather unique plot with a lot of customizations, matplotlib is still the best choice.
タスク
スワイプしてコーディングを開始
Import the seaborn library with the sns alias.
解答
すべて明確でしたか?
フィードバックありがとうございます!
セクション 1. 章 17
single
AIに質問する
AIに質問する

何でも質問するか、提案された質問の1つを試してチャットを始めてください
