Example of LSTM
メニューを表示するにはスワイプしてください
An example of how LSTM networks can be applied to time series prediction is explored. The following graph illustrates the performance of Company A over a period of five months.
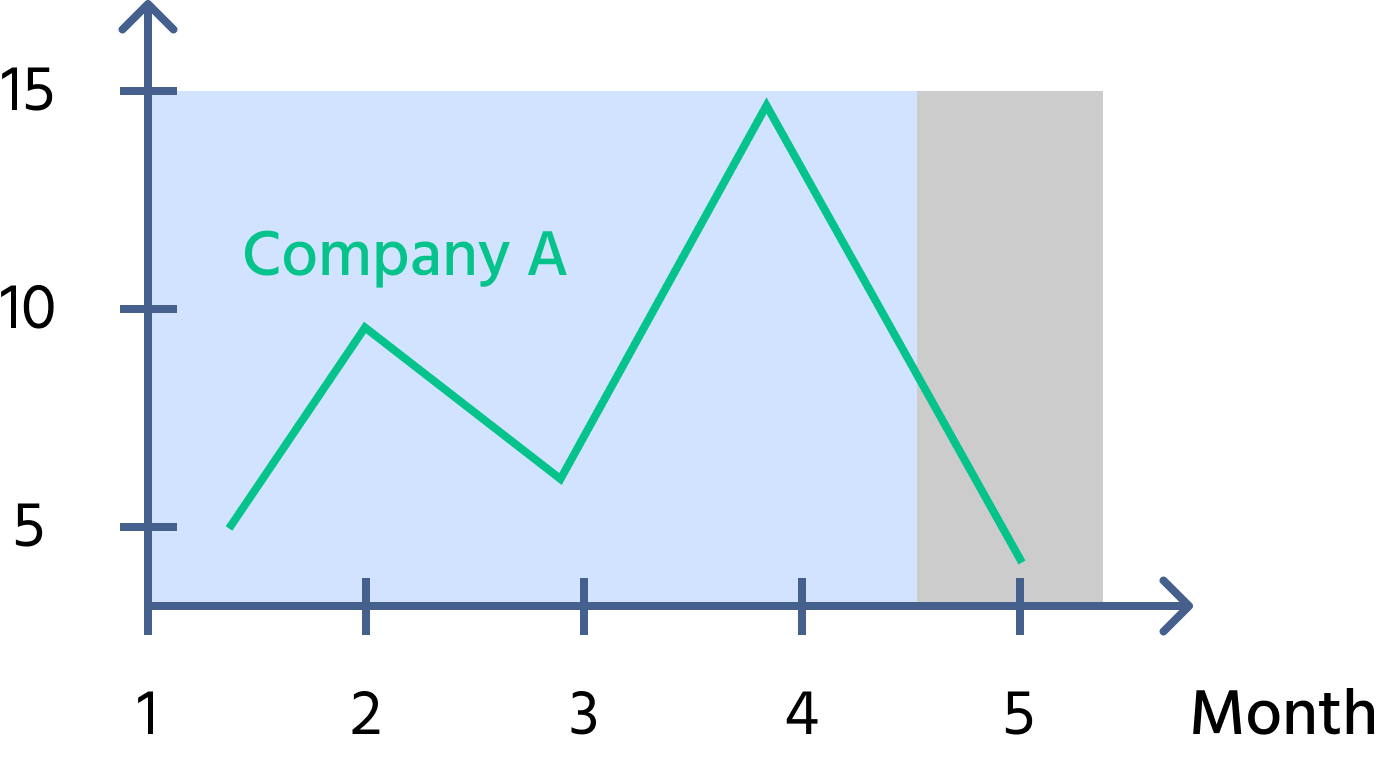
- Data: the x-axis represents the months, while the y-axis shows the performance metric (e.g., sales, revenue, etc.) ranging from 5 to 15;
- Time series forecasting: an LSTM can be used to analyze the trend and predict future values based on past data. In the graph, we can see fluctuations, which LSTM will analyze to predict future months;
- LSTM application: using past months' data, the LSTM network learns the pattern of increases and decreases in Company A's performance and can forecast future performance trends.
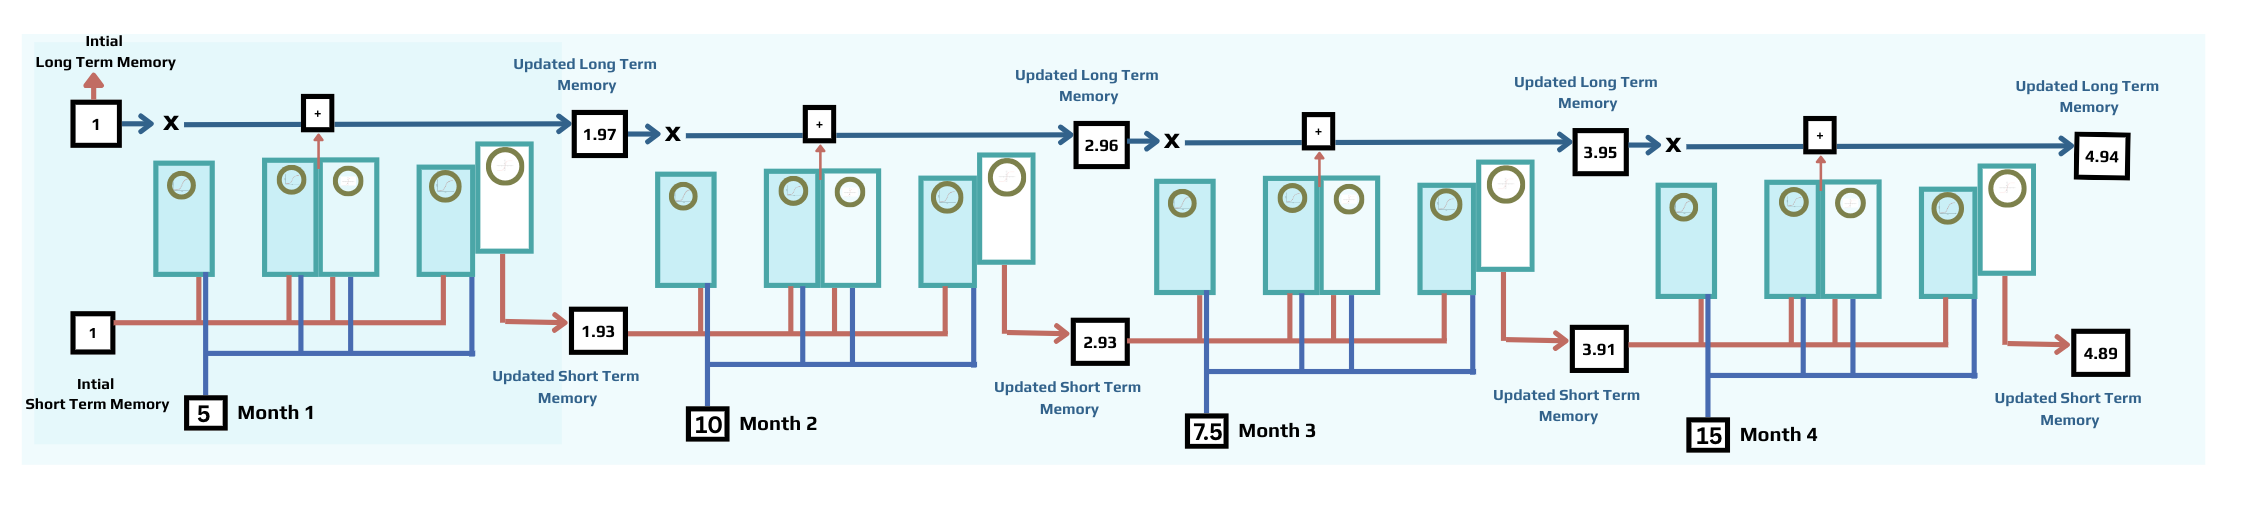
This is a typical application of LSTM in business forecasting, where past performance is used to predict future trends. The LSTM model learns from the time series data and can be used for more accurate predictions, especially when there are complex dependencies over time.
すべて明確でしたか?
フィードバックありがとうございます!
セクション 2. 章 4
AIに質問する
AIに質問する

何でも質問するか、提案された質問の1つを試してチャットを始めてください
セクション 2. 章 4
