Swarmplot
メニューを表示するにはスワイプしてください
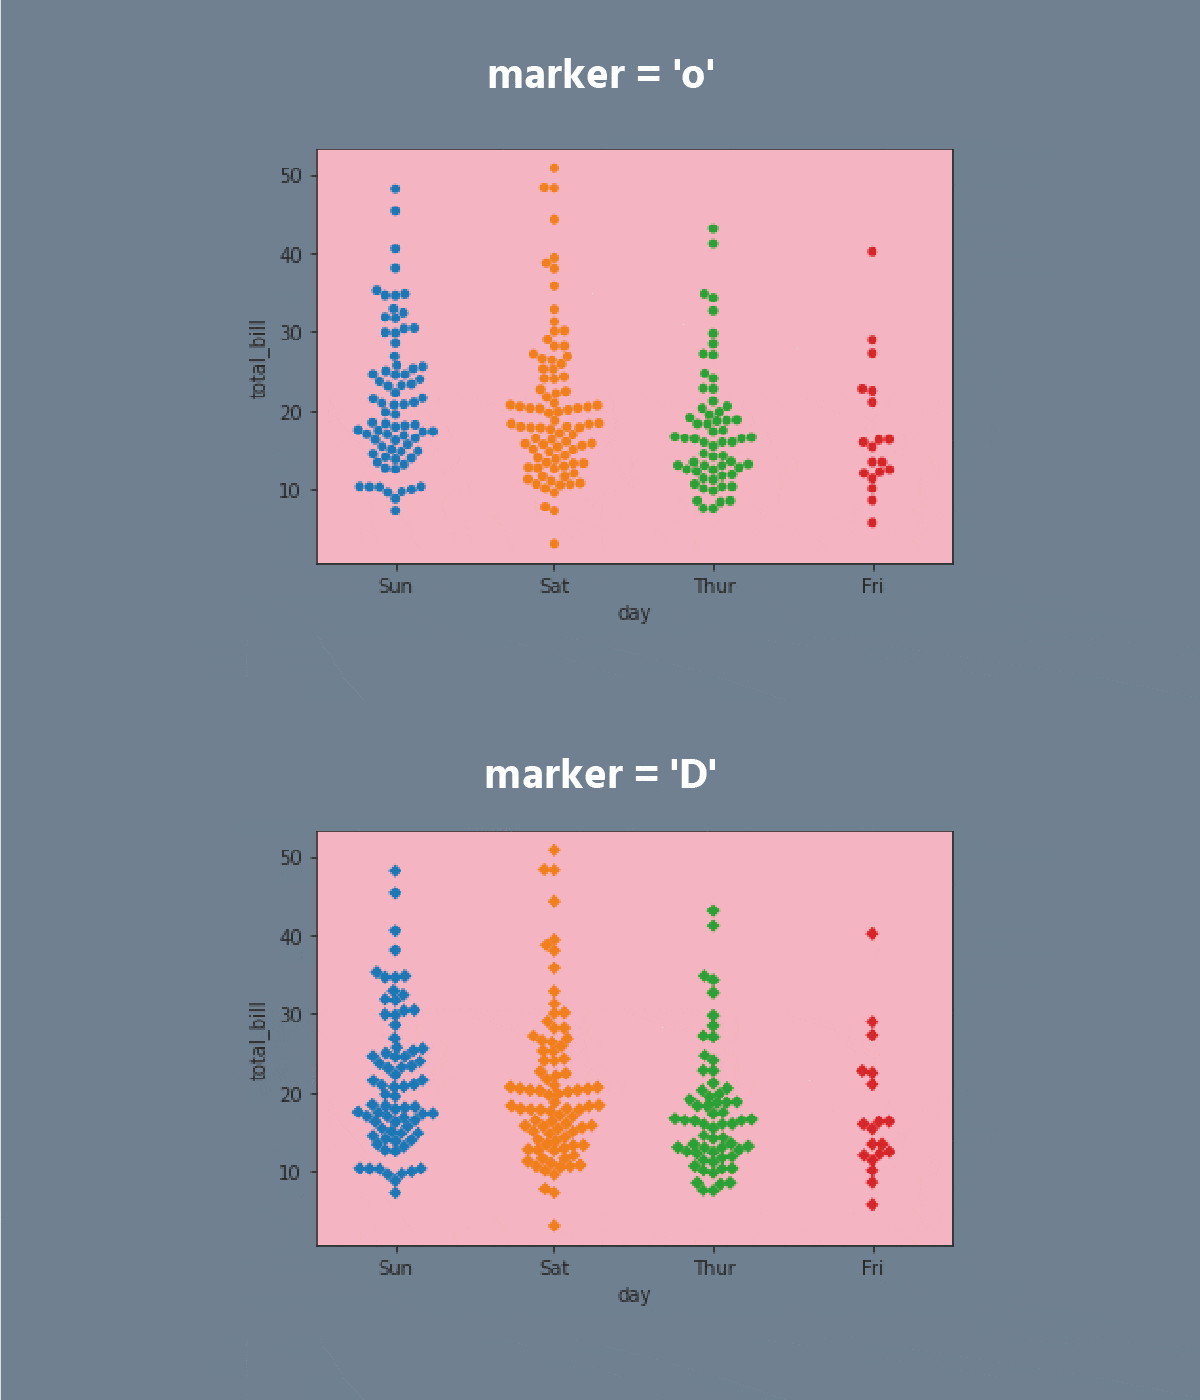
The swarmplot is similar to stripplot. Only the points are adjusted so they won't overlap, as it helps to represent the distribution of values better.




タスク
スワイプしてコーディングを開始
- Set the
'whitegrid'style with the'seashell'axes.facecolor. - Create the
swarmplotusing theseabornlibrary:
xparameter equals the'day';- Set the
yparameter equals the'total_bill'; - Set the
hueparameter equals the'sex'; - Set the
linewidthparameter equals1; - Set the
sizeparameter equals2; - Set the
dodgeparameter equals theTrue; - Set the
'rocket'palette.
解答
 実践的な練習のためにデスクトップに切り替える下記のオプションのいずれかを利用して、現在の場所から続行する
すべて明確でしたか?
フィードバックありがとうございます!
セクション 3. 章 2

single
AIに質問する

AIに質問する

何でも質問するか、提案された質問の1つを試してチャットを始めてください
