single
Challenge
Scorri per mostrare il menu
In this challenge, you are given the good old housing dataset, but this time only with the 'age' feature.
1234import pandas as pd df = pd.read_csv('https://codefinity-content-media.s3.eu-west-1.amazonaws.com/b22d1166-efda-45e8-979e-6c3ecfc566fc/houses_poly.csv') print(df.head())
Let's build a scatterplot of this data.
1234567import pandas as pd import matplotlib.pyplot as plt df = pd.read_csv('https://codefinity-content-media.s3.eu-west-1.amazonaws.com/b22d1166-efda-45e8-979e-6c3ecfc566fc/houses_poly.csv') X = df['age'] y = df['price'] plt.scatter(X, y, alpha=0.4)
Fitting a straight line to this data may not be a great choice.
The price gets higher for either brand-new or really old houses.
Fitting a parabola looks like a better choice. And that's what you will do in this challenge.
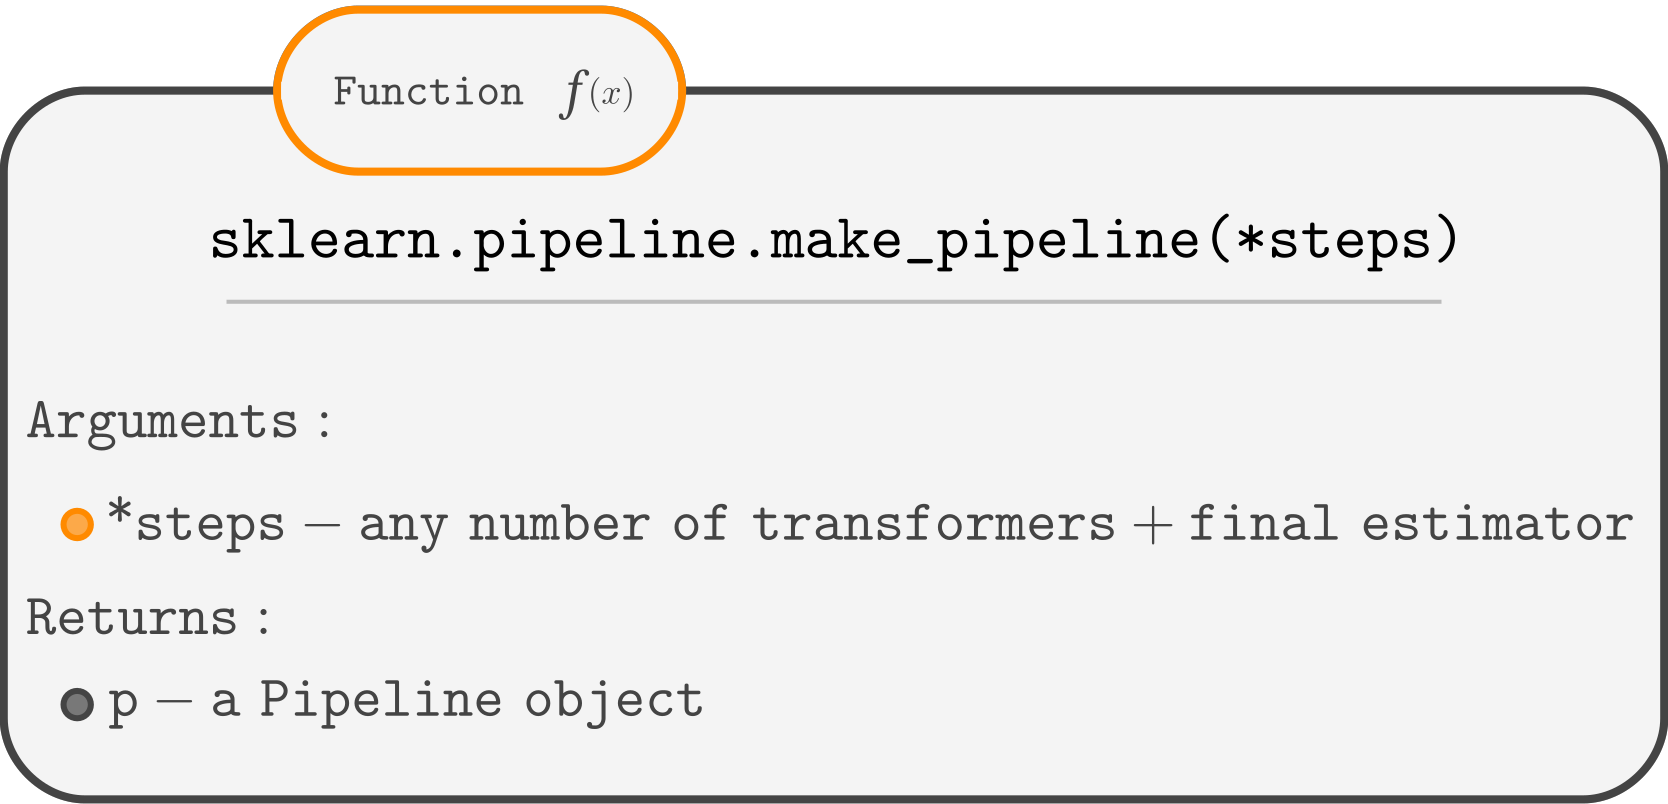
The task is to build a Polynomial Regression of degree 2 using a pipeline, as was shown in a previous chapter.
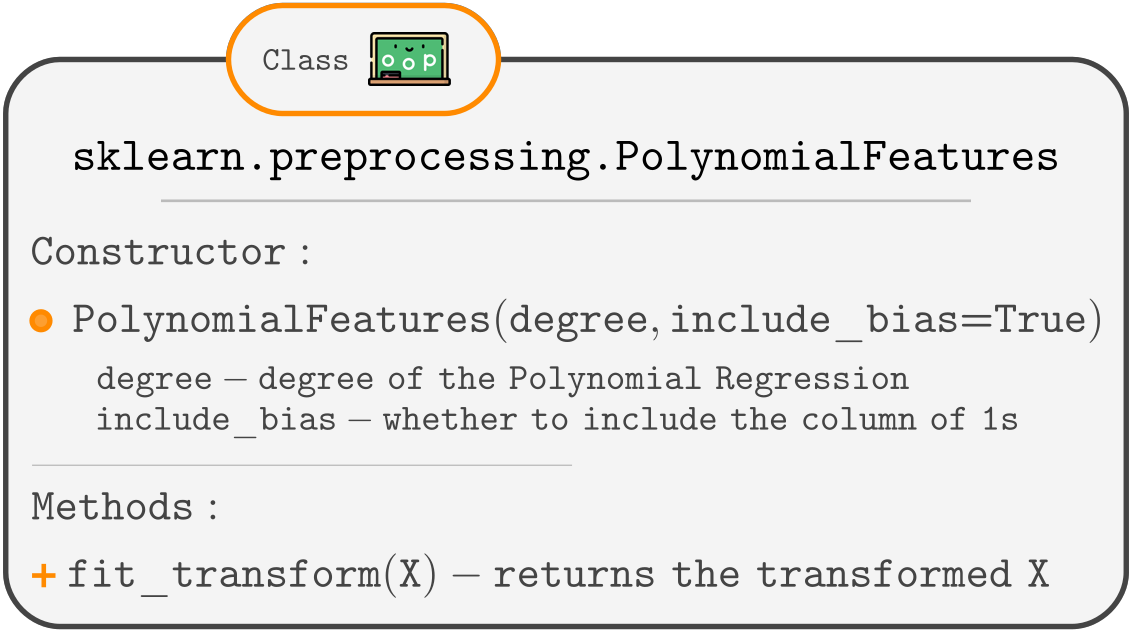
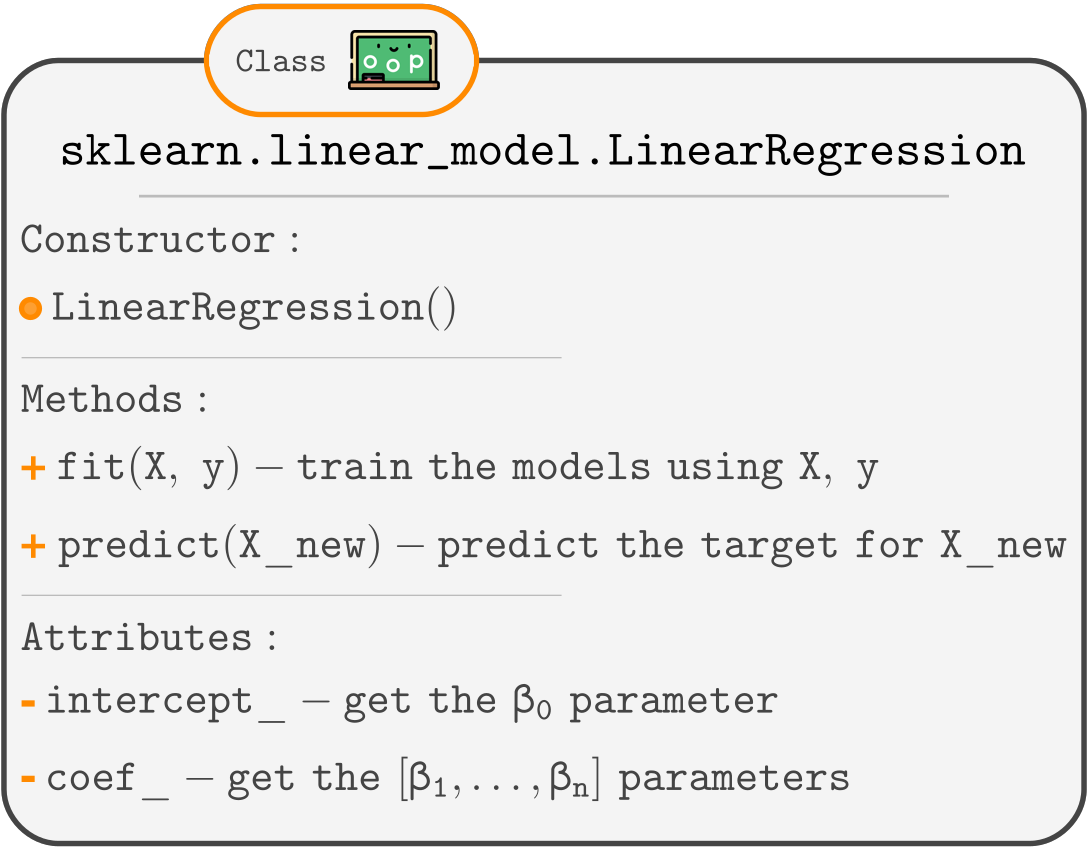
Here is a list of the classes and functions from sklearn that you will need.
Scorri per iniziare a programmare
- Create a model using the
make_pipelinefunction.
As function arguments, pass the instances of classes that:- adds polynomial features of a degree
n(don't forget to set theinclude_biastoFalse). - performs Linear Regression.
- adds polynomial features of a degree
- Train the model.
- Predict the target for
X_new.
Soluzione
Grazie per i tuoi commenti!
single
Chieda ad AI
Chieda ad AI

Chieda pure quello che desidera o provi una delle domande suggerite per iniziare la nostra conversazione
