Seabornin Esittely
Seaborn on korkean tason visualisointikirjasto, joka pohjautuu matplotlib-kirjastoon. Tarkastellaan sen etuja verrattuna matplotlib-kirjastoon:
- yksinkertaisempi käyttöliittymä;
- laaja valikoima oletustyylejä ja väripaletteja;
- toimii hyvin yhteen
pandasDataFrame -rakenteen kanssa; - monipuoliset sisäänrakennetut tilastolliset toiminnot.
Alla esimerkki kuvaajasta, joka on luotu seaborn-kirjastolla yhdellä koodirivillä:
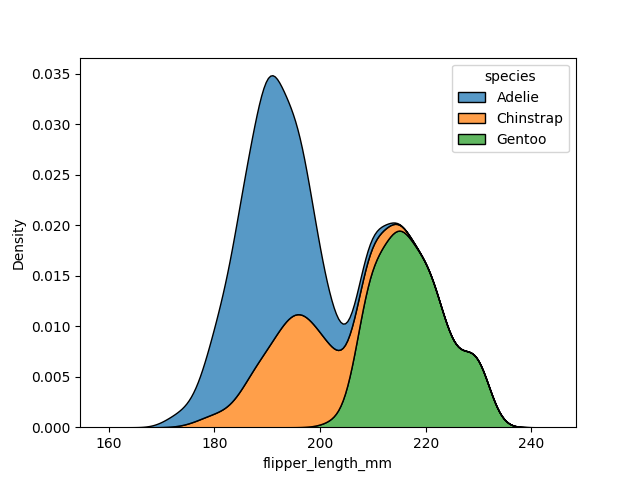
Kaikki, mitä voit toteuttaa seaborn-kirjastolla, on mahdollista tehdä myös matplotlib-kirjastolla, mutta se saattaa usein vaatia enemmän aikaa ja vaivaa.
Kuitenkin, koska matplotlib on verrattain alhaisen tason kirjasto, se tarjoaa enemmän joustavuutta kaavioiden luomiseen. Jos tarvitset hyvin yksilöllisen kaavion, jossa on runsaasti mukautuksia, matplotlib on edelleen paras valinta.
Kiitos palautteestasi!
single
Seabornin Esittely
Pyyhkäise näyttääksesi valikon
Seaborn on korkean tason visualisointikirjasto, joka pohjautuu matplotlib-kirjastoon. Tarkastellaan sen etuja verrattuna matplotlib-kirjastoon:
- yksinkertaisempi käyttöliittymä;
- laaja valikoima oletustyylejä ja väripaletteja;
- toimii hyvin yhteen
pandasDataFrame -rakenteen kanssa; - monipuoliset sisäänrakennetut tilastolliset toiminnot.
Alla esimerkki kuvaajasta, joka on luotu seaborn-kirjastolla yhdellä koodirivillä:
Kaikki, mitä voit toteuttaa seaborn-kirjastolla, on mahdollista tehdä myös matplotlib-kirjastolla, mutta se saattaa usein vaatia enemmän aikaa ja vaivaa.
Kuitenkin, koska matplotlib on verrattain alhaisen tason kirjasto, se tarjoaa enemmän joustavuutta kaavioiden luomiseen. Jos tarvitset hyvin yksilöllisen kaavion, jossa on runsaasti mukautuksia, matplotlib on edelleen paras valinta.
Pyyhkäise aloittaaksesi koodauksen
Tuo seaborn-kirjasto käyttäen aliasta sns.
Ratkaisu
Kiitos palautteestasi!
single
Kysy tekoälyä
Kysy tekoälyä

Kysy mitä tahansa tai kokeile jotakin ehdotetuista kysymyksistä aloittaaksesi keskustelumme
