Notice: This page requires JavaScript to function properly.
Please enable JavaScript in your browser settings or update your browser.
Challenge | Polynomial Regression
Linear Regression for ML
course content

Contenido del Curso

Linear Regression for ML

Linear Regression for ML

1. Simple Linear Regression
2. Multiple Linear Regression
3. Polynomial Regression
4. Evaluating and Comparing Models

bookChallenge

In this challenge, you are given the good old housing dataset, but this time only with the 'age' feature.

1234
import pandas as pd df = pd.read_csv('https://codefinity-content-media.s3.eu-west-1.amazonaws.com/b22d1166-efda-45e8-979e-6c3ecfc566fc/houses_poly.csv') print(df.head())
copy

Let's build a scatterplot of this data.

1234567
import pandas as pd import matplotlib.pyplot as plt df = pd.read_csv('https://codefinity-content-media.s3.eu-west-1.amazonaws.com/b22d1166-efda-45e8-979e-6c3ecfc566fc/houses_poly.csv') X = df['age'] y = df['price'] plt.scatter(X, y, alpha=0.4)
copy

Fitting a straight line to this data may not be a great choice.
The price gets higher for either brand-new or really old houses.
Fitting a parabola looks like a better choice. And that's what you will do in this challenge.

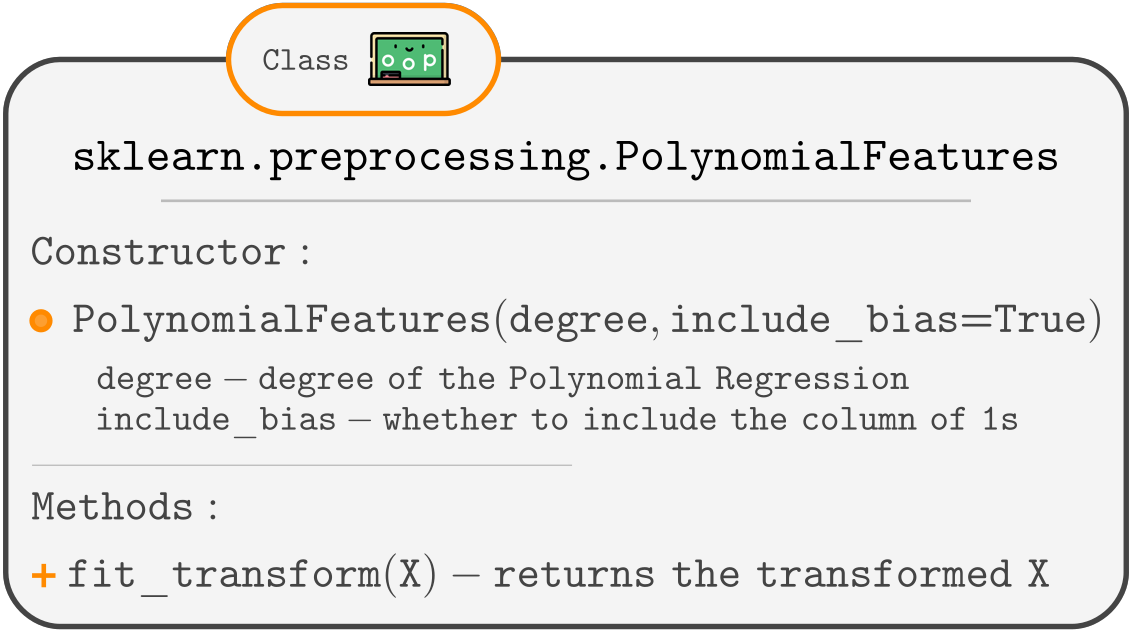
The task is to build a Polynomial Regression of degree 2 using a pipeline, as was shown in a previous chapter. Here is a list of the classes and functions from sklearn that you will need.
carousel-imgcarousel-imgcarousel-img

Tarea

  1. Create a model using the make_pipeline function.
    As function arguments, pass the instances of classes that:
    • adds polynomial features of a degree n (don't forget to set the include_bias to False).
    • performs Linear Regression.
  2. Train the model.
  3. Predict the target for X_new.

Switch to desktopCambia al escritorio para practicar en el mundo realContinúe desde donde se encuentra utilizando una de las siguientes opciones
¿Todo estuvo claro?

¿Cómo podemos mejorarlo?

¡Gracias por tus comentarios!

Sección 3. Capítulo 6
toggle bottom row

bookChallenge

In this challenge, you are given the good old housing dataset, but this time only with the 'age' feature.

1234
import pandas as pd df = pd.read_csv('https://codefinity-content-media.s3.eu-west-1.amazonaws.com/b22d1166-efda-45e8-979e-6c3ecfc566fc/houses_poly.csv') print(df.head())
copy

Let's build a scatterplot of this data.

1234567
import pandas as pd import matplotlib.pyplot as plt df = pd.read_csv('https://codefinity-content-media.s3.eu-west-1.amazonaws.com/b22d1166-efda-45e8-979e-6c3ecfc566fc/houses_poly.csv') X = df['age'] y = df['price'] plt.scatter(X, y, alpha=0.4)
copy

Fitting a straight line to this data may not be a great choice.
The price gets higher for either brand-new or really old houses.
Fitting a parabola looks like a better choice. And that's what you will do in this challenge.

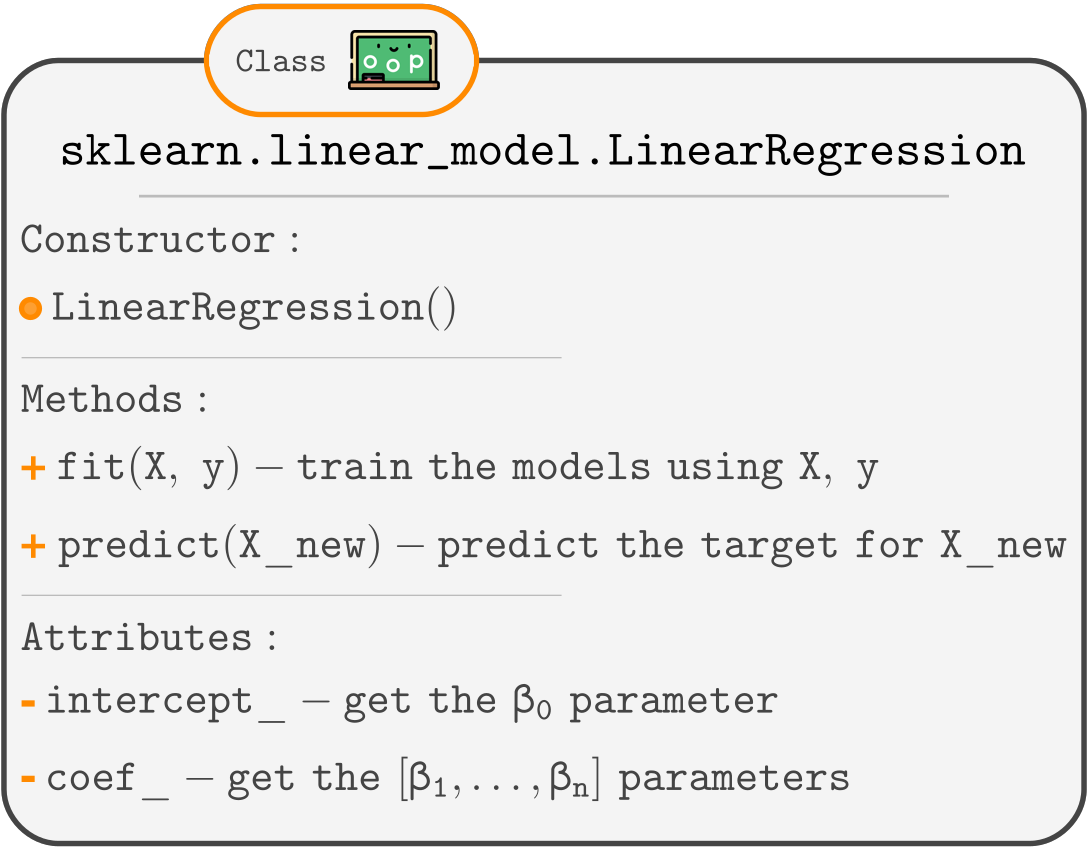
The task is to build a Polynomial Regression of degree 2 using a pipeline, as was shown in a previous chapter. Here is a list of the classes and functions from sklearn that you will need.
carousel-imgcarousel-imgcarousel-img

Tarea

  1. Create a model using the make_pipeline function.
    As function arguments, pass the instances of classes that:
    • adds polynomial features of a degree n (don't forget to set the include_bias to False).
    • performs Linear Regression.
  2. Train the model.
  3. Predict the target for X_new.

Switch to desktopCambia al escritorio para practicar en el mundo realContinúe desde donde se encuentra utilizando una de las siguientes opciones
¿Todo estuvo claro?

¿Cómo podemos mejorarlo?

¡Gracias por tus comentarios!

Sección 3. Capítulo 6
toggle bottom row

bookChallenge

In this challenge, you are given the good old housing dataset, but this time only with the 'age' feature.

1234
import pandas as pd df = pd.read_csv('https://codefinity-content-media.s3.eu-west-1.amazonaws.com/b22d1166-efda-45e8-979e-6c3ecfc566fc/houses_poly.csv') print(df.head())
copy

Let's build a scatterplot of this data.

1234567
import pandas as pd import matplotlib.pyplot as plt df = pd.read_csv('https://codefinity-content-media.s3.eu-west-1.amazonaws.com/b22d1166-efda-45e8-979e-6c3ecfc566fc/houses_poly.csv') X = df['age'] y = df['price'] plt.scatter(X, y, alpha=0.4)
copy

Fitting a straight line to this data may not be a great choice.
The price gets higher for either brand-new or really old houses.
Fitting a parabola looks like a better choice. And that's what you will do in this challenge.

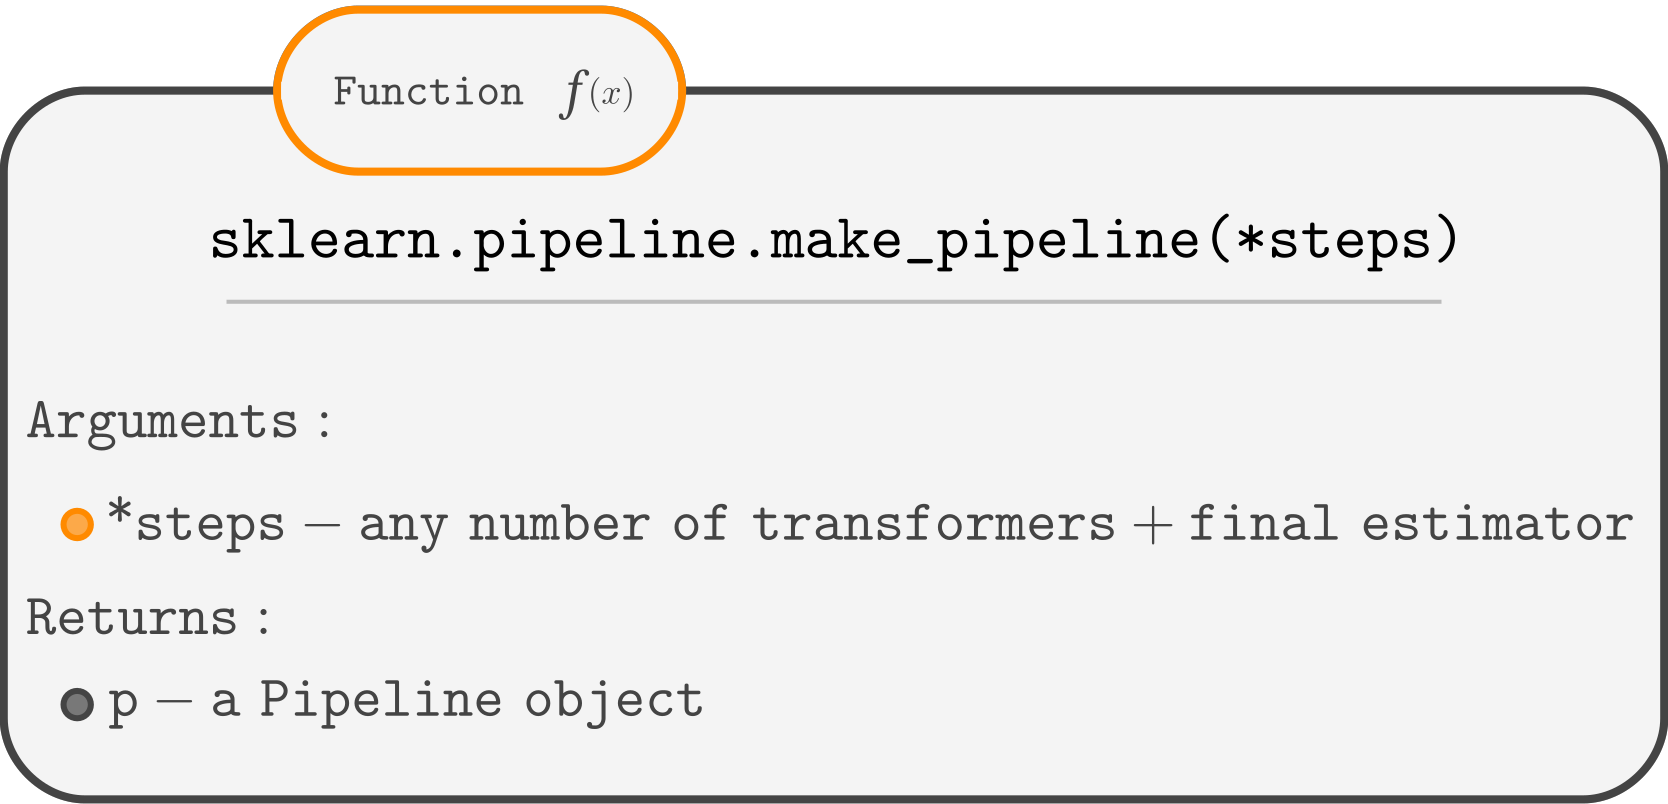
The task is to build a Polynomial Regression of degree 2 using a pipeline, as was shown in a previous chapter. Here is a list of the classes and functions from sklearn that you will need.
carousel-imgcarousel-imgcarousel-img

Tarea

  1. Create a model using the make_pipeline function.
    As function arguments, pass the instances of classes that:
    • adds polynomial features of a degree n (don't forget to set the include_bias to False).
    • performs Linear Regression.
  2. Train the model.
  3. Predict the target for X_new.

Switch to desktopCambia al escritorio para practicar en el mundo realContinúe desde donde se encuentra utilizando una de las siguientes opciones
¿Todo estuvo claro?

¿Cómo podemos mejorarlo?

¡Gracias por tus comentarios!

In this challenge, you are given the good old housing dataset, but this time only with the 'age' feature.

1234
import pandas as pd df = pd.read_csv('https://codefinity-content-media.s3.eu-west-1.amazonaws.com/b22d1166-efda-45e8-979e-6c3ecfc566fc/houses_poly.csv') print(df.head())
copy

Let's build a scatterplot of this data.

1234567
import pandas as pd import matplotlib.pyplot as plt df = pd.read_csv('https://codefinity-content-media.s3.eu-west-1.amazonaws.com/b22d1166-efda-45e8-979e-6c3ecfc566fc/houses_poly.csv') X = df['age'] y = df['price'] plt.scatter(X, y, alpha=0.4)
copy

Fitting a straight line to this data may not be a great choice.
The price gets higher for either brand-new or really old houses.
Fitting a parabola looks like a better choice. And that's what you will do in this challenge.

The task is to build a Polynomial Regression of degree 2 using a pipeline, as was shown in a previous chapter. Here is a list of the classes and functions from sklearn that you will need.

carousel-imgcarousel-imgcarousel-img

Tarea

  1. Create a model using the make_pipeline function.
    As function arguments, pass the instances of classes that:
    • adds polynomial features of a degree n (don't forget to set the include_bias to False).
    • performs Linear Regression.
  2. Train the model.
  3. Predict the target for X_new.

Switch to desktopCambia al escritorio para practicar en el mundo realContinúe desde donde se encuentra utilizando una de las siguientes opciones
Sección 3. Capítulo 6
Switch to desktopCambia al escritorio para practicar en el mundo realContinúe desde donde se encuentra utilizando una de las siguientes opciones
some-alt