Heatmap
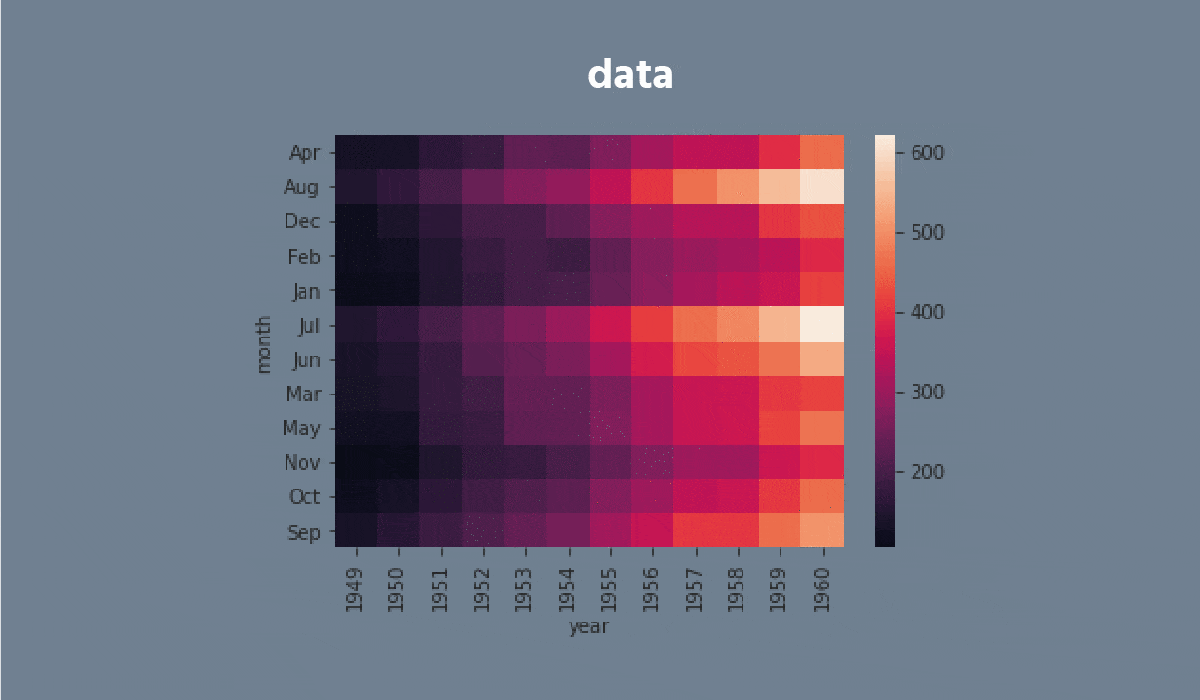
A heatmap is a plot of rectangular data as a color-encoded matrix. As a parameter, it takes a 2D dataset. That dataset can be coerced into an ndarray.
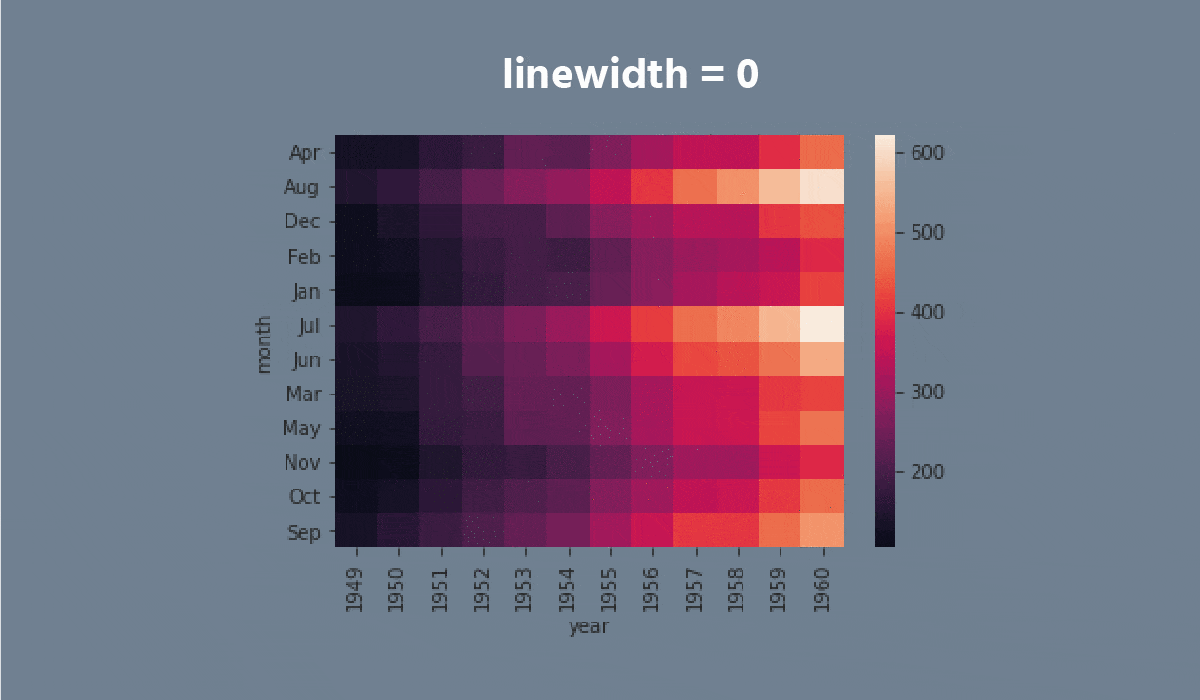
This is a great way to visualize data because it can show the relation between variables, including time. For instance, the number of flights through the years.


¡Gracias por tus comentarios!
single
Heatmap
Desliza para mostrar el menú
A heatmap is a plot of rectangular data as a color-encoded matrix. As a parameter, it takes a 2D dataset. That dataset can be coerced into an ndarray.
This is a great way to visualize data because it can show the relation between variables, including time. For instance, the number of flights through the years.
Desliza para comenzar a programar
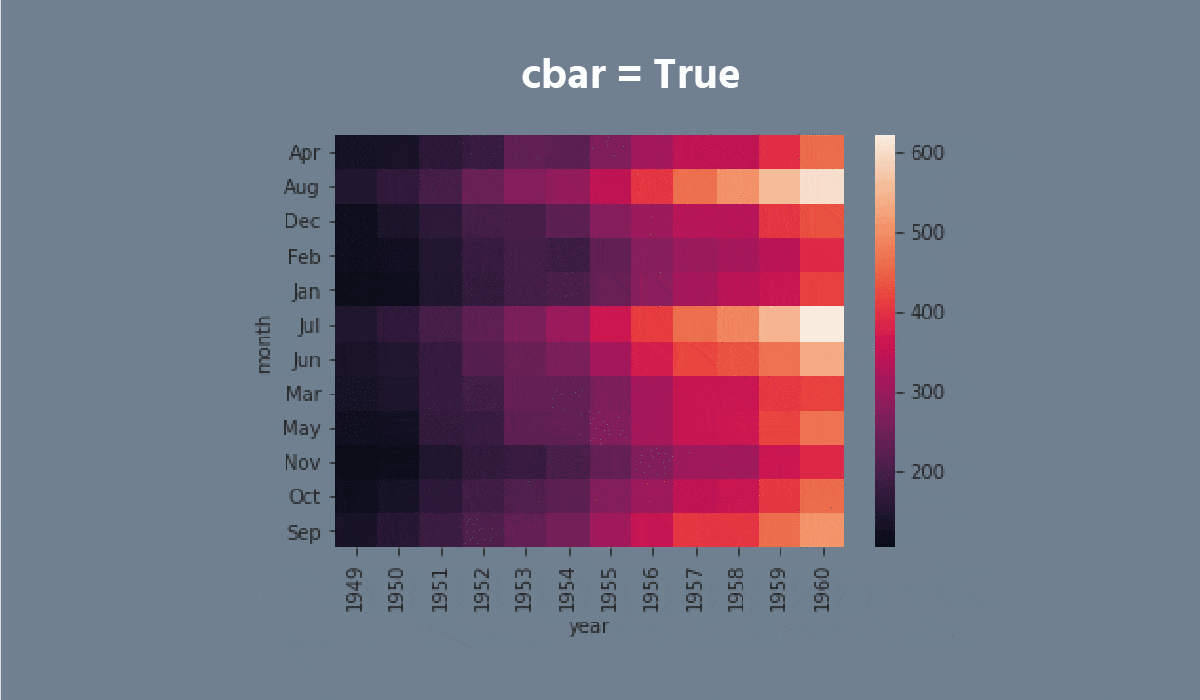
- Set the
'ticks'style with the'seagreen'figure.facecolor. - Create the
heatmapusing theseabornlibrary:
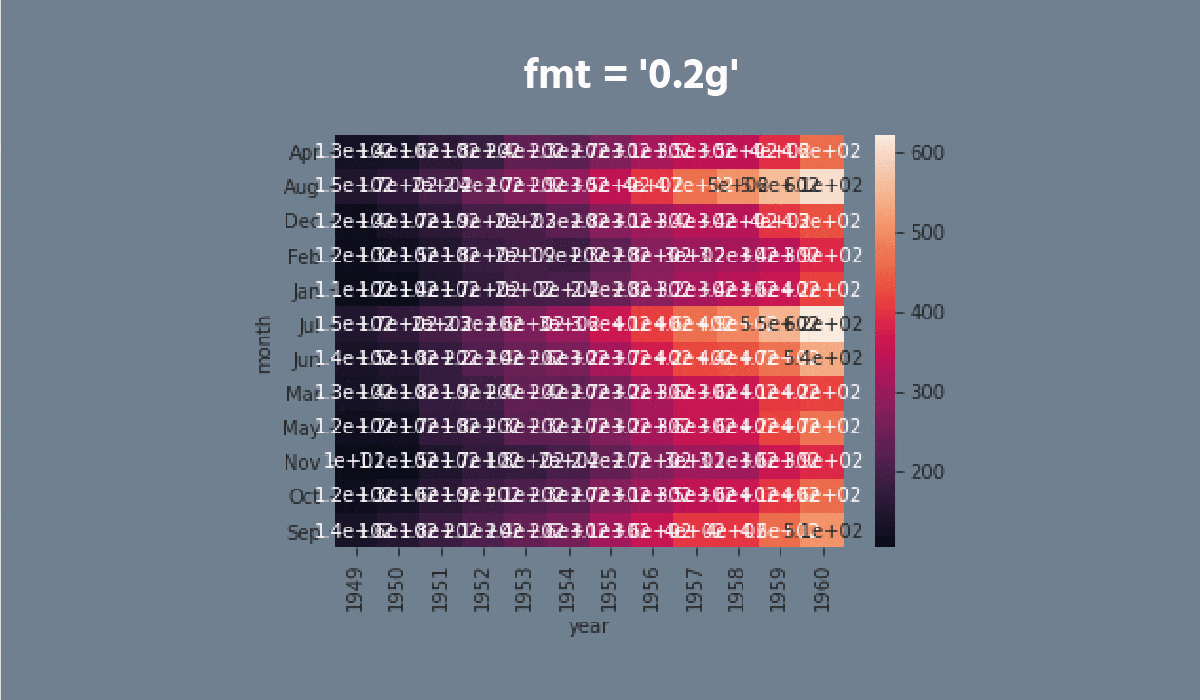
- Add the data for the
heatmap. You only need to input the name of the DataFrame (withoutdata = ...); - Set the
'viridis'cmapparameter; - Add the
annotparameter; - Set the
fmtparameter equals the'0.99g'; - Set the
linecolorparameter equals the'plum'; - Display the plot.
Solución
¡Gracias por tus comentarios!
single
Pregunte a AI
Pregunte a AI

Pregunte lo que quiera o pruebe una de las preguntas sugeridas para comenzar nuestra charla
