¿Por Qué Importa Matplotlib?
Matplotlib es una biblioteca de Python potente y ampliamente utilizada para crear visualizaciones estáticas, animadas e interactivas. Ofrece una forma flexible y personalizable de generar una amplia variedad de gráficos y diagramas, incluyendo gráficos de líneas, gráficos de barras, histogramas, diagramas de dispersión y más.
Aunque ofrece una funcionalidad integral para crear diversos tipos de gráficos, sigue siendo sorprendentemente fácil de usar. Además, matplotlib es de código abierto, lo que significa que está disponible de forma gratuita y es mejorado continuamente por una gran comunidad.
matplotlib es un excelente punto de partida para aprender visualización de datos en Python, ya que muchas otras bibliotecas están construidas sobre ella.
Antes de profundizar en matplotlib, observemos un ejemplo de un gráfico creado con su ayuda:
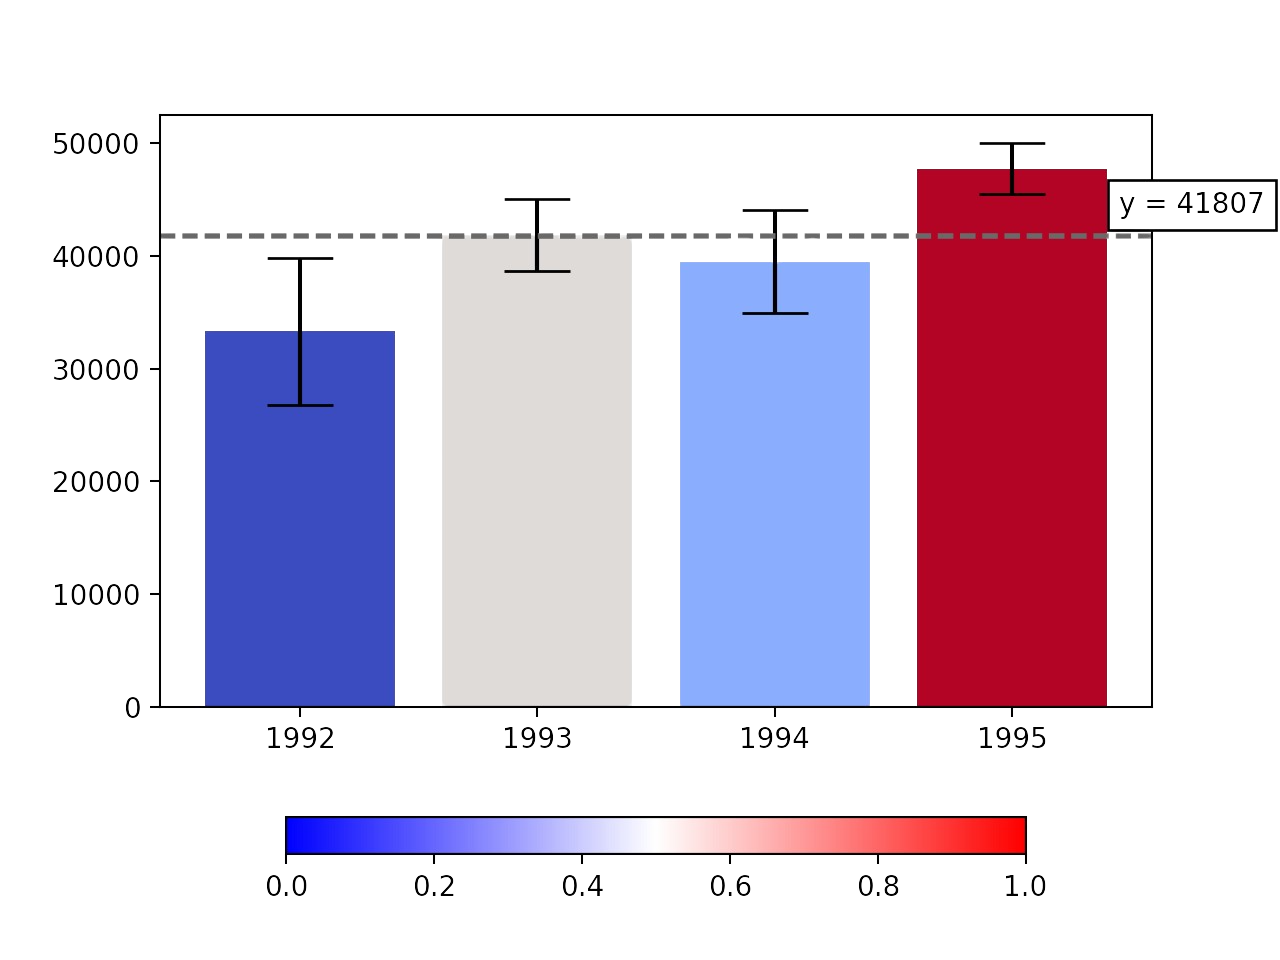
Este gráfico puede crearse con solo unas pocas líneas de código. Además, es posible hacerlo interactivo, lo que demuestra las capacidades de matplotlib.
La mayoría de las utilidades de matplotlib se encuentran en el submódulo pyplot, que se utiliza a lo largo del curso.
¡Gracias por tus comentarios!
single
¿Por Qué Importa Matplotlib?
Desliza para mostrar el menú
Matplotlib es una biblioteca de Python potente y ampliamente utilizada para crear visualizaciones estáticas, animadas e interactivas. Ofrece una forma flexible y personalizable de generar una amplia variedad de gráficos y diagramas, incluyendo gráficos de líneas, gráficos de barras, histogramas, diagramas de dispersión y más.
Aunque ofrece una funcionalidad integral para crear diversos tipos de gráficos, sigue siendo sorprendentemente fácil de usar. Además, matplotlib es de código abierto, lo que significa que está disponible de forma gratuita y es mejorado continuamente por una gran comunidad.
matplotlib es un excelente punto de partida para aprender visualización de datos en Python, ya que muchas otras bibliotecas están construidas sobre ella.
Antes de profundizar en matplotlib, observemos un ejemplo de un gráfico creado con su ayuda:
Este gráfico puede crearse con solo unas pocas líneas de código. Además, es posible hacerlo interactivo, lo que demuestra las capacidades de matplotlib.
La mayoría de las utilidades de matplotlib se encuentran en el submódulo pyplot, que se utiliza a lo largo del curso.
Desliza para comenzar a programar
Existen dos formas posibles de importarlo; la primera es más común, mientras que la segunda es más apropiada según la PEP.
- Importación del submódulo
pyplotde la bibliotecamatplotlibcon el aliaspltsin utilizar la palabra clavefrom. - Importación del submódulo
pyplotde la bibliotecamatplotlibcon el aliaspltutilizando la palabra clavefrom.
Solución
¡Gracias por tus comentarios!
single
Pregunte a AI
Pregunte a AI

Pregunte lo que quiera o pruebe una de las preguntas sugeridas para comenzar nuestra charla
