single
Silhouette Scores
Desliza para mostrar el menú
Did you notice how the cluster's centers were placed in the previous chapter? That is where you can notice the key difference between K-Means and K-Medoids algorithm - in the second method the centers (medoids) have to be the data points, which makes this algorithm more useful in the case of 'uniformly' distributed points.
In the previous section, we used the total within sum of squares as defining factor for choosing the necessary number of clusters.
Consider the next metric we can use for number of clusters defining: silhouette score.
What is a Silhouette score?
The silhouette score - is the mean of all the silhouette scores calculated for each observation. There are two values calculated for each observation: mean intro-cluster distance (mean of all the distances between point and points within a predicted cluster) denoted as a, and mean nearest-cluster distance (mean of all the distances between point and all the points of the nearest cluster) denoted as b. Then, the value of (b-a)/max(a,b) is calculated for each point, and all the values are averaged. This will be the silhouette score for clustering into a certain number of clusters.
In Python, the silhouette score can be calculated by using the silhouette_score function from sklearn.metrics with two necessary parameters: the first is data used for fitting, and the second is the predicted model labels.
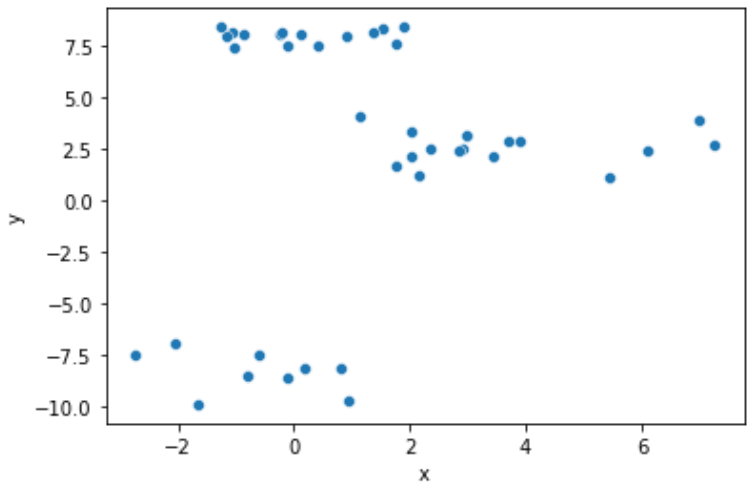
Like for the total within sum of squares, we can also calculate the scores for a different number of clusters, then analyze the plot, and make the decision. But how should we interpret such a plot? Consider the example with random points, and two-dimensional data. The scatter plot of the data is shown below.
Let's use for loop to iterate over a different number of clusters, and then calculate the silhouette scores.
12345678910111213141516171819202122232425# Import the libraries import pandas as pd import matplotlib.pyplot as plt import seaborn as sns from sklearn_extra.cluster import KMedoids from sklearn.metrics import silhouette_score # Read the data data = pd.read_csv('https://codefinity-content-media.s3.eu-west-1.amazonaws.com/138ab9ad-aa37-4310-873f-0f62abafb038/model_data1.csv') # Creating lists n_cl = range(2, 9) silhouettes = [] # Calculating silhouette scores for different number of clusters for i in n_cl: model = KMedoids(n_clusters = i) model.fit(data) silhouettes.append(silhouette_score(data, model.labels_)) # Visualize the results g = sns.lineplot(x = n_cl, y = silhouettes) g.set_xlabel('Number of clusters') g.set_ylabel('Silhouette score') plt.show()
The optimal number of clusters is the 'peak' of the line, where on both left and right sides are smaller values. In the chart above, the best choice is 3, but also 6 seems like an interesting choice. By the way, this method also applies to the K-Means algorithm.
Let's see how will the silhouette scores chart look for the 3-4 clusters points.
Desliza para comenzar a programar
Given a 2-D set of points data. The scatter plot of data is shown below.
You need to build a line plot number of clusters vs silhouette score for 2-8 clusters. Follow the next steps:
- Import
silhouette_scorefromsklearn.metricsandKMedoidsfromsklearn_extra.cluster. - Within the
forloop:
- Create
KMedoidsmodelwithiclusters. - Fit the
datato themodel. - Add silhouette score to
silhouetteslist. Remember, the first parameter of the function is the data used for fitting.
- Build a line plot with
n_clon the x-axis andsilhouetteson the y-axis.
Solución
¡Gracias por tus comentarios!
single
Pregunte a AI
Pregunte a AI

Pregunte lo que quiera o pruebe una de las preguntas sugeridas para comenzar nuestra charla
