 JointGrid
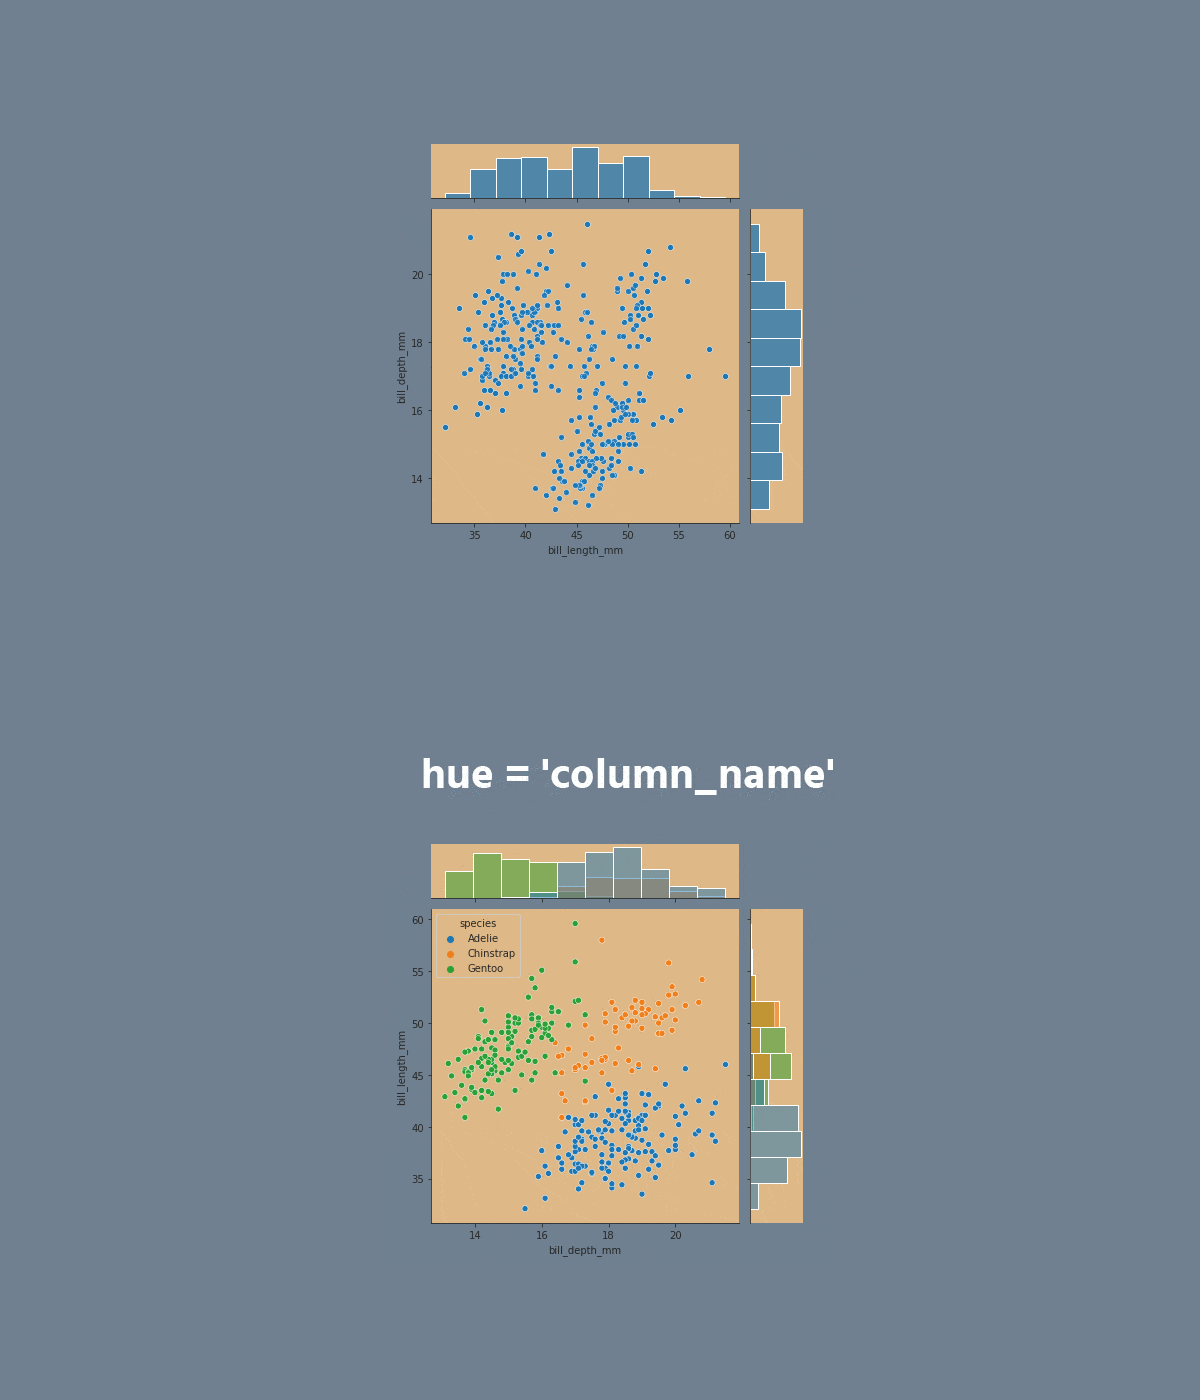
JointGrid is a figure-level function, when the function is called a JointGrid object is instantiated. The function creates a JointGrid object consisting of three axes objects but does not plot anything on it.


import pandas as pd
import seaborn as sns
from matplotlib import pyplot as plt

df = pd.read_csv('filename.csv')

# Creating the JointGrid variable
g = sns.JointGrid(x = 'column_name', y = 'column_name', data = df)

# Creating the inside plot
g.plot_joint(sns.scatterplot)

# Creating the outside plot
g.plot_marginals(sns.histplot)

plt.show()
Swipe to start coding
- Set the
'ticks'style with the'lightcyan'figure.facecolor. - Create a
JointGridvariableg:
- Set the
xparameter equals the'bill_length_mm'; - Set the
yparameter equals the'bill_depth_mm'; - Set the
hueparameter equals the'species'; - Set the
'viridis'palette; - Set the data.
Set the inside plot using the .plot_joint() function using the g variable:
- Create a
scatterplotusing theseaborn; - Set the
alphaparameter equals0.5; - Set the
'pink'edgecolorparameter; - Set the
linewidthparameter equals1.
Set the outside plot using the .plot_marginals() function:
- Create the
histplotusing theseaborn; - Add the
kdeparameter.
Lösung
Danke für Ihr Feedback!
single
Fragen Sie AI
Fragen Sie AI

Fragen Sie alles oder probieren Sie eine der vorgeschlagenen Fragen, um unser Gespräch zu beginnen

Großartig!
Completion Rate verbessert auf 4.35 JointGrid
Swipe um das Menü anzuzeigen
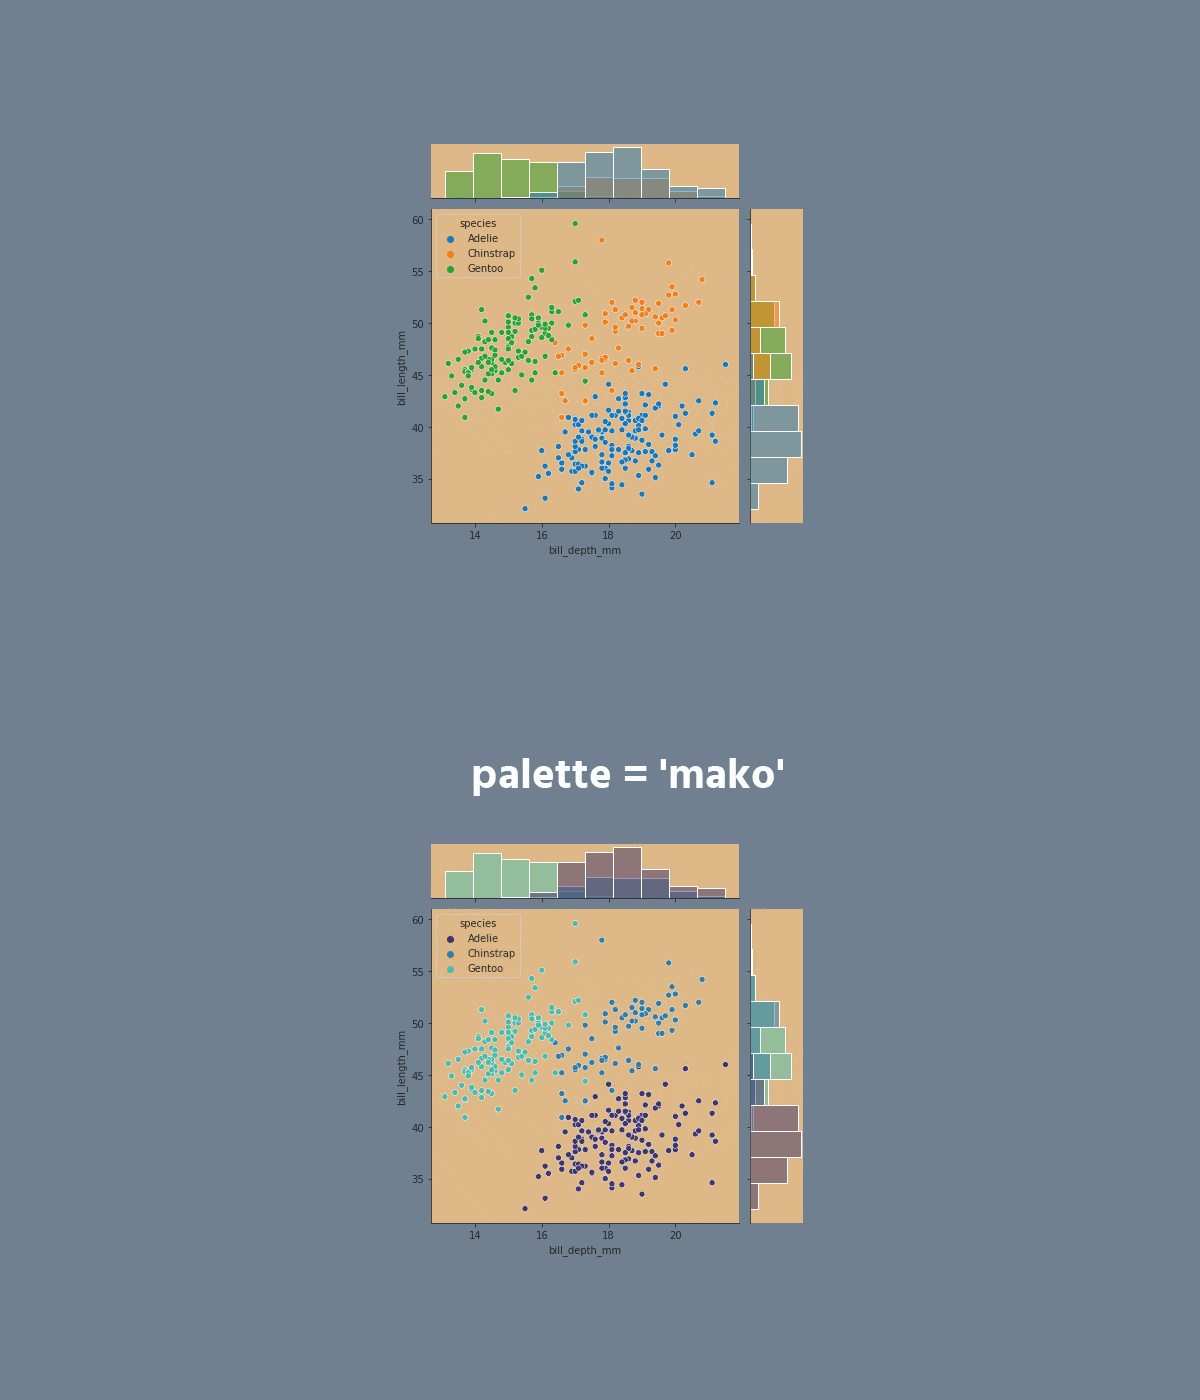
JointGrid is a figure-level function, when the function is called a JointGrid object is instantiated. The function creates a JointGrid object consisting of three axes objects but does not plot anything on it.


import pandas as pd
import seaborn as sns
from matplotlib import pyplot as plt

df = pd.read_csv('filename.csv')

# Creating the JointGrid variable
g = sns.JointGrid(x = 'column_name', y = 'column_name', data = df)

# Creating the inside plot
g.plot_joint(sns.scatterplot)

# Creating the outside plot
g.plot_marginals(sns.histplot)

plt.show()
Swipe to start coding
- Set the
'ticks'style with the'lightcyan'figure.facecolor. - Create a
JointGridvariableg:
- Set the
xparameter equals the'bill_length_mm'; - Set the
yparameter equals the'bill_depth_mm'; - Set the
hueparameter equals the'species'; - Set the
'viridis'palette; - Set the data.
Set the inside plot using the .plot_joint() function using the g variable:
- Create a
scatterplotusing theseaborn; - Set the
alphaparameter equals0.5; - Set the
'pink'edgecolorparameter; - Set the
linewidthparameter equals1.
Set the outside plot using the .plot_marginals() function:
- Create the
histplotusing theseaborn; - Add the
kdeparameter.
Lösung
Danke für Ihr Feedback!
single