Show Values As and Comparative Analysis
Stryg for at vise menuen
Pivot Tables can display values in different ways without changing the underlying calculation. Instead of showing raw totals, you can display percentages, differences, rankings, or running totals. In this chapter, you'll use Show Values As to compare performance.
By default, Pivot Tables display values as standard aggregations: Sum, Count, Average.
However, you can change how those values are presented.
Using "Show Values As"
To change how a value is displayed:
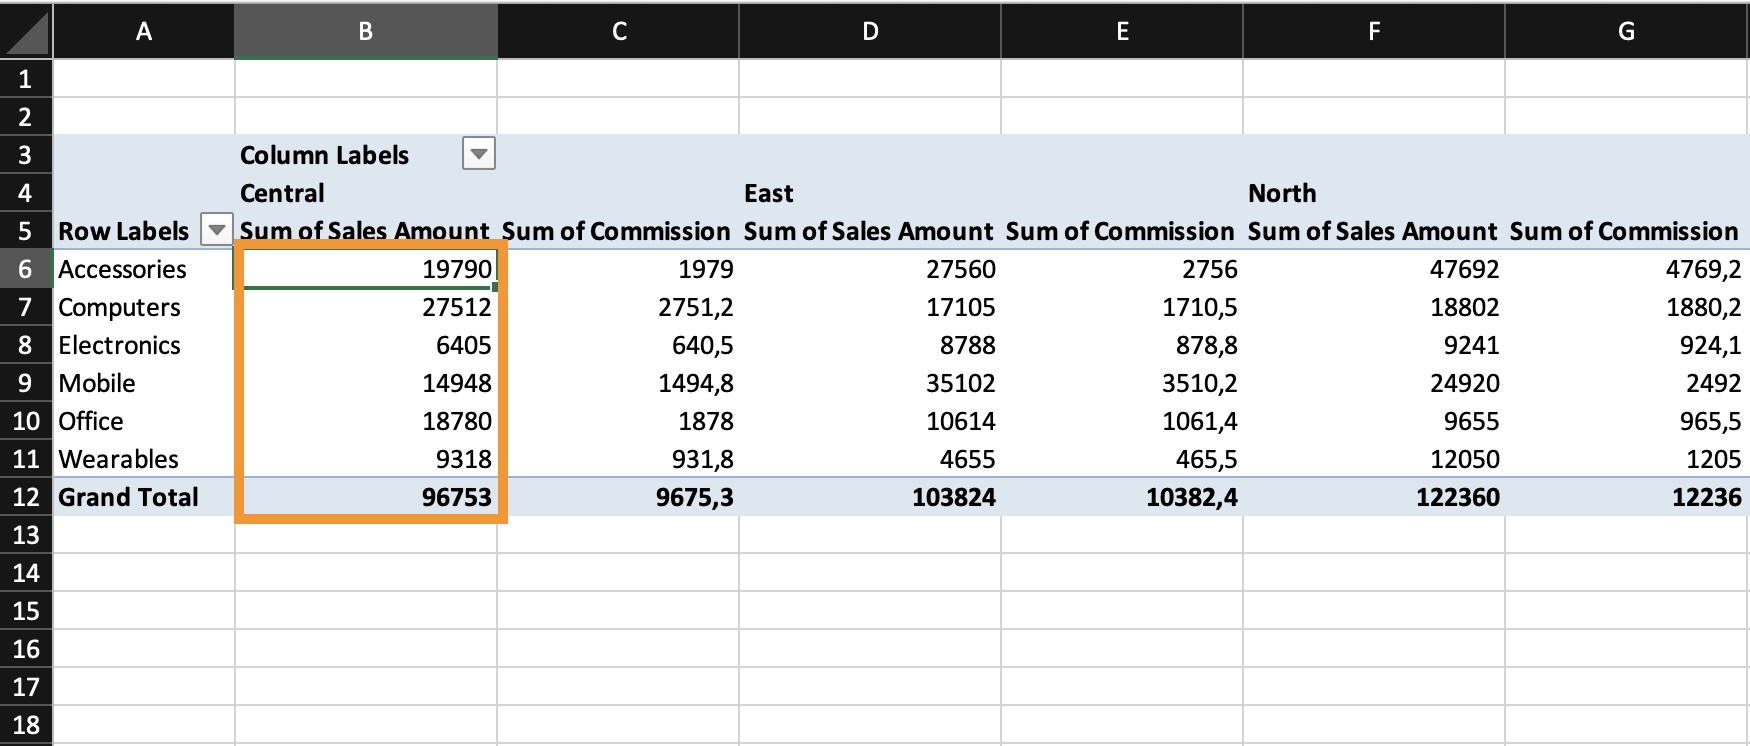
- Click any numeric cell in the Pivot Table;
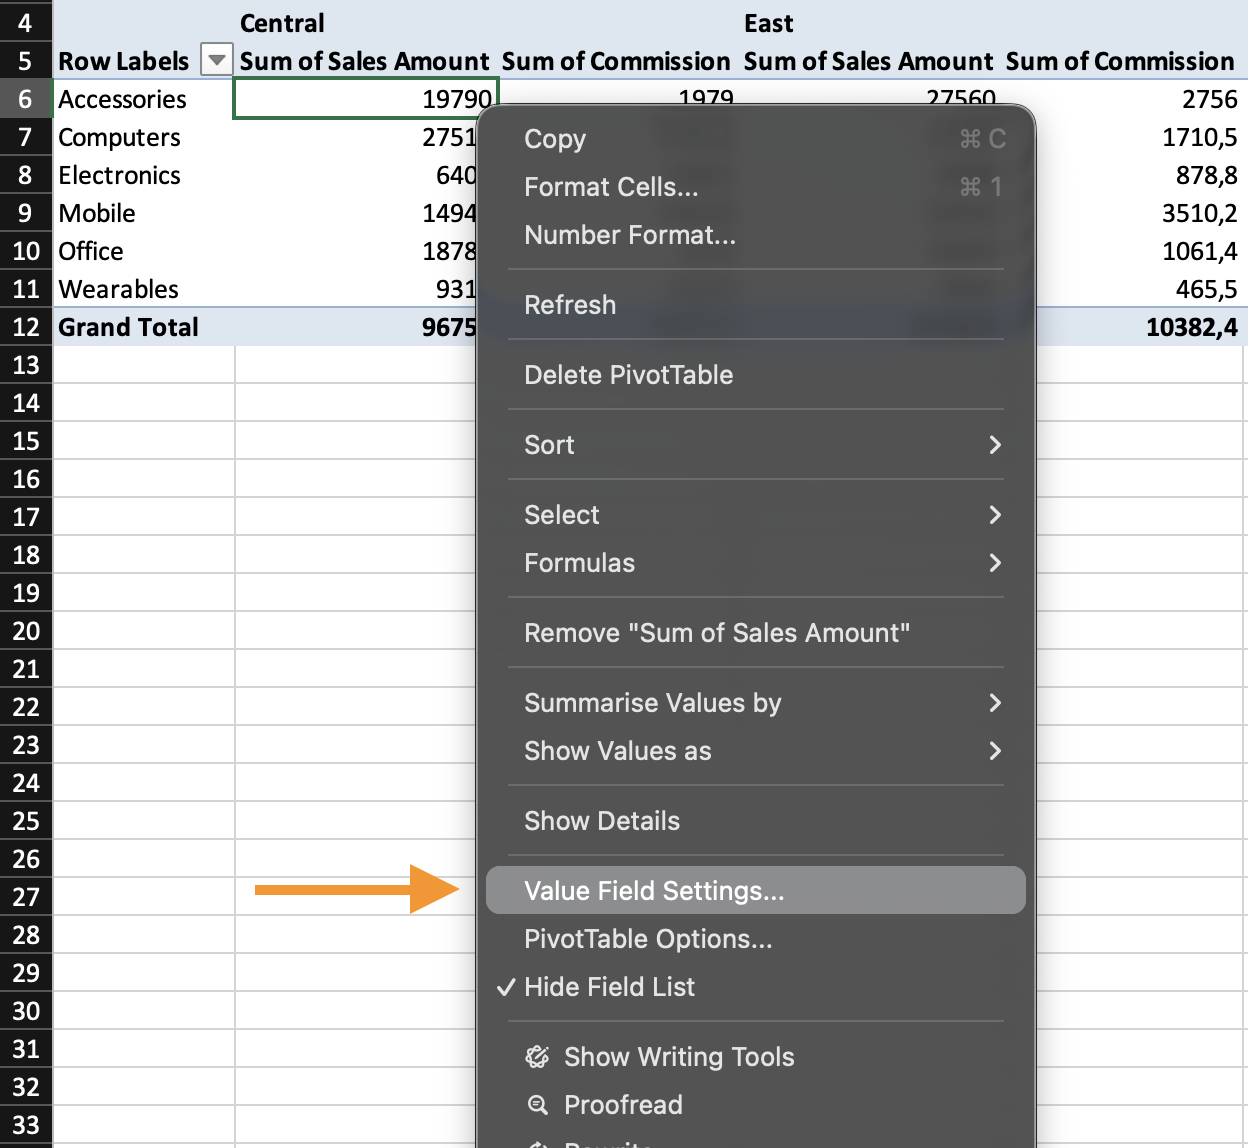
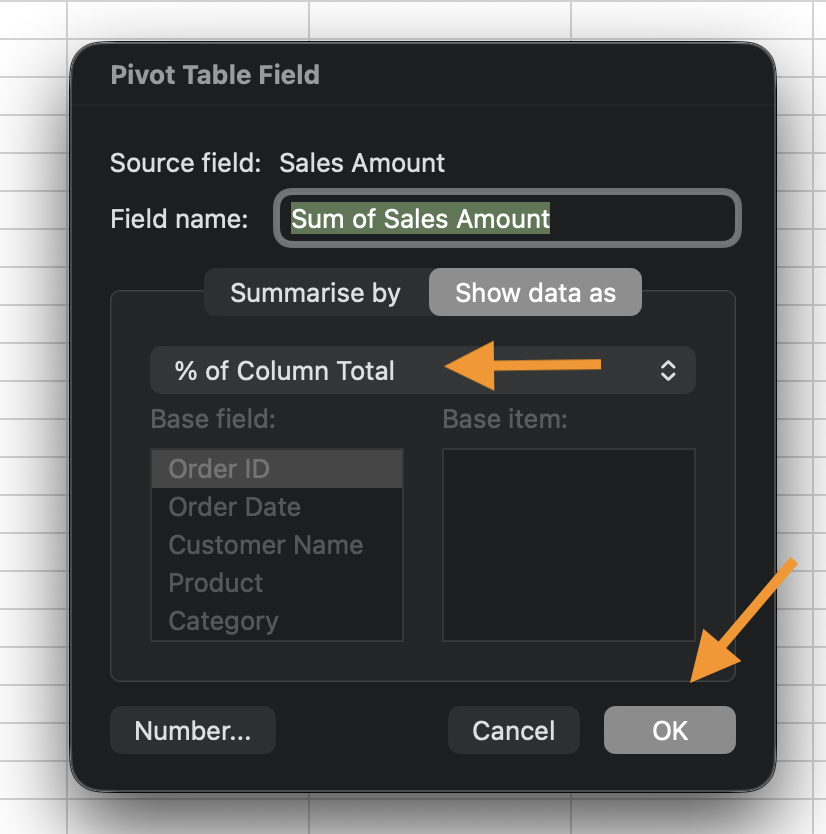
- Open Value Field Settings;
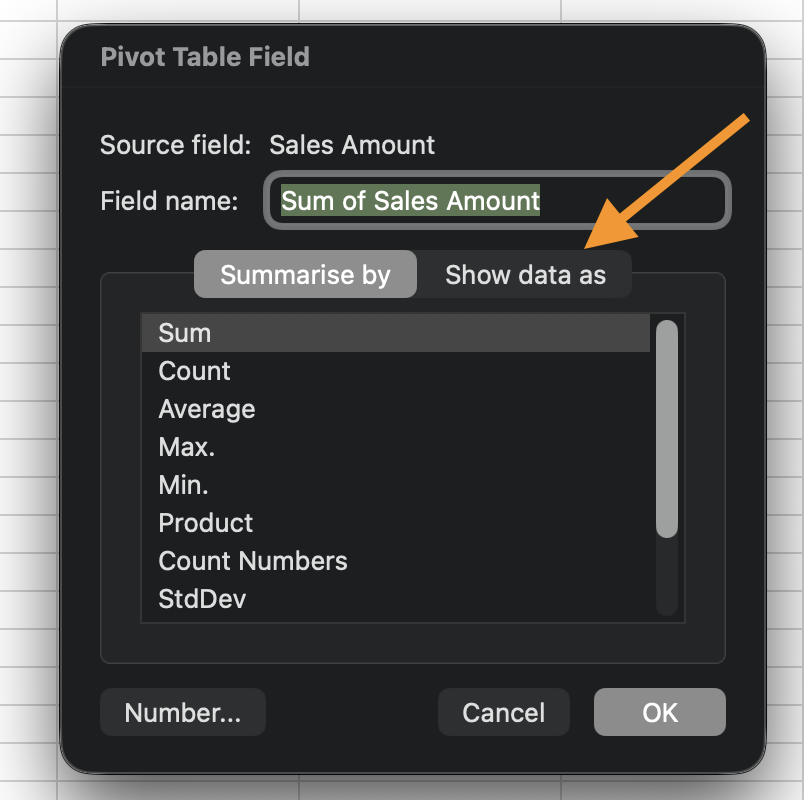
- Go to the Show Data As tab;
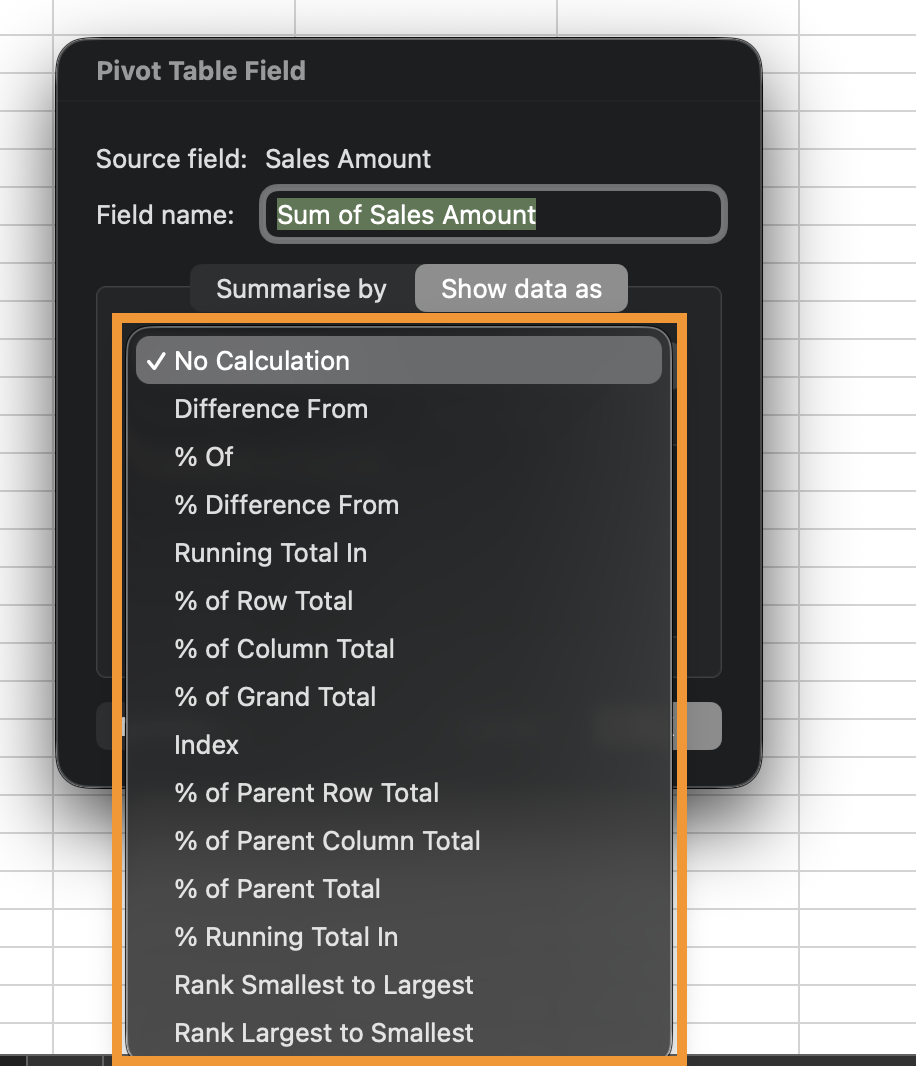
- Choose a calculation type.
This does not change the original aggregation. It changes only how the result is displayed.
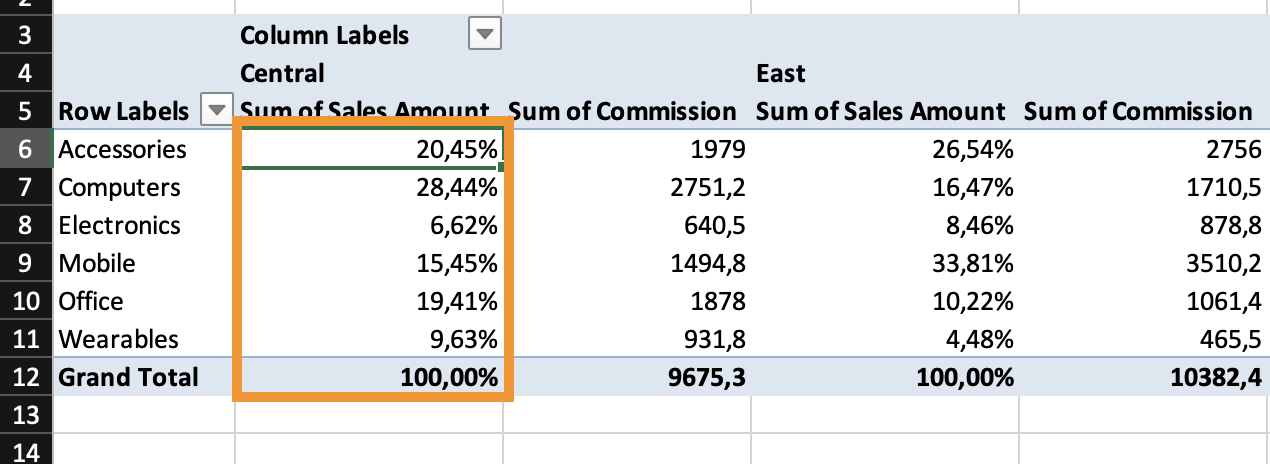
Common Comparative Calculations
Task
Create a Pivot Table with:
- Rows: Category;
- Columns: Region;
- Values: Sum of Revenue.
Add Revenue again and set it to:
% of Grand Total.
Add Revenue again and set it to:
% of Row Total.
Tak for dine kommentarer!
Spørg AI

Spørg AI

Spørg om hvad som helst eller prøv et af de foreslåede spørgsmål for at starte vores chat
Show Values As and Comparative Analysis
Pivot Tables can display values in different ways without changing the underlying calculation. Instead of showing raw totals, you can display percentages, differences, rankings, or running totals. In this chapter, you'll use Show Values As to compare performance.
By default, Pivot Tables display values as standard aggregations: Sum, Count, Average.
However, you can change how those values are presented.
Using "Show Values As"
To change how a value is displayed:
- Click any numeric cell in the Pivot Table;
- Open Value Field Settings;
- Go to the Show Data As tab;
- Choose a calculation type.
This does not change the original aggregation. It changes only how the result is displayed.
Common Comparative Calculations
Task
Create a Pivot Table with:
- Rows: Category;
- Columns: Region;
- Values: Sum of Revenue.
Add Revenue again and set it to:
% of Grand Total.
Add Revenue again and set it to:
% of Row Total.
Tak for dine kommentarer!
