Creating Your First Pivot Table
Swipe to show menu
Once your data is prepared, you can summarize it using a Pivot Table.
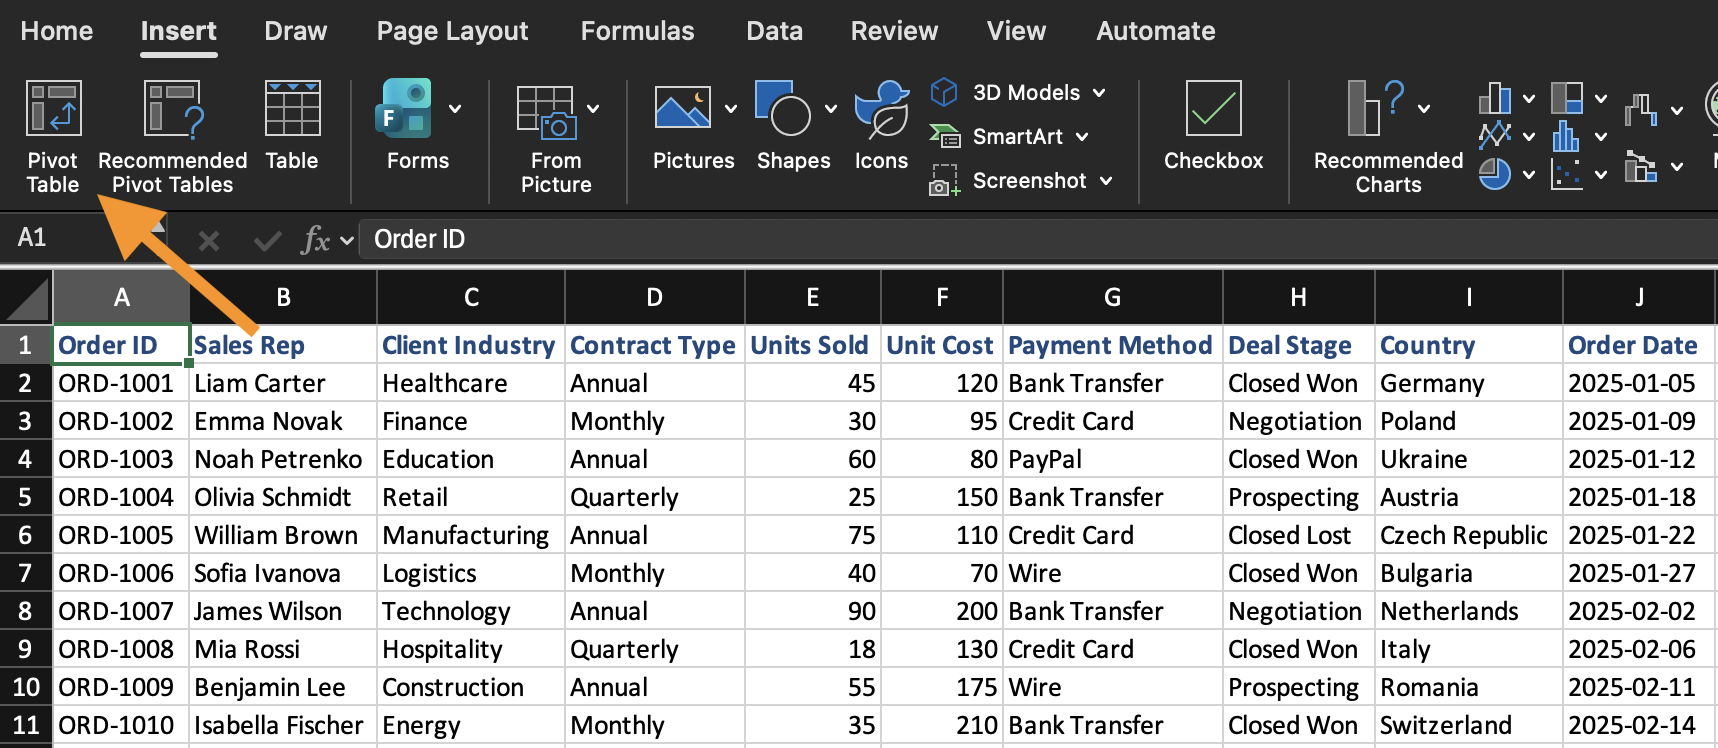
A Pivot Table is created from an existing dataset. To insert a Pivot Table:
- Select any cell inside the dataset;
- Open the Insert tab;
- Click PivotTable;
- Confirm the data range;
- Choose to place the Pivot Table on a new worksheet.
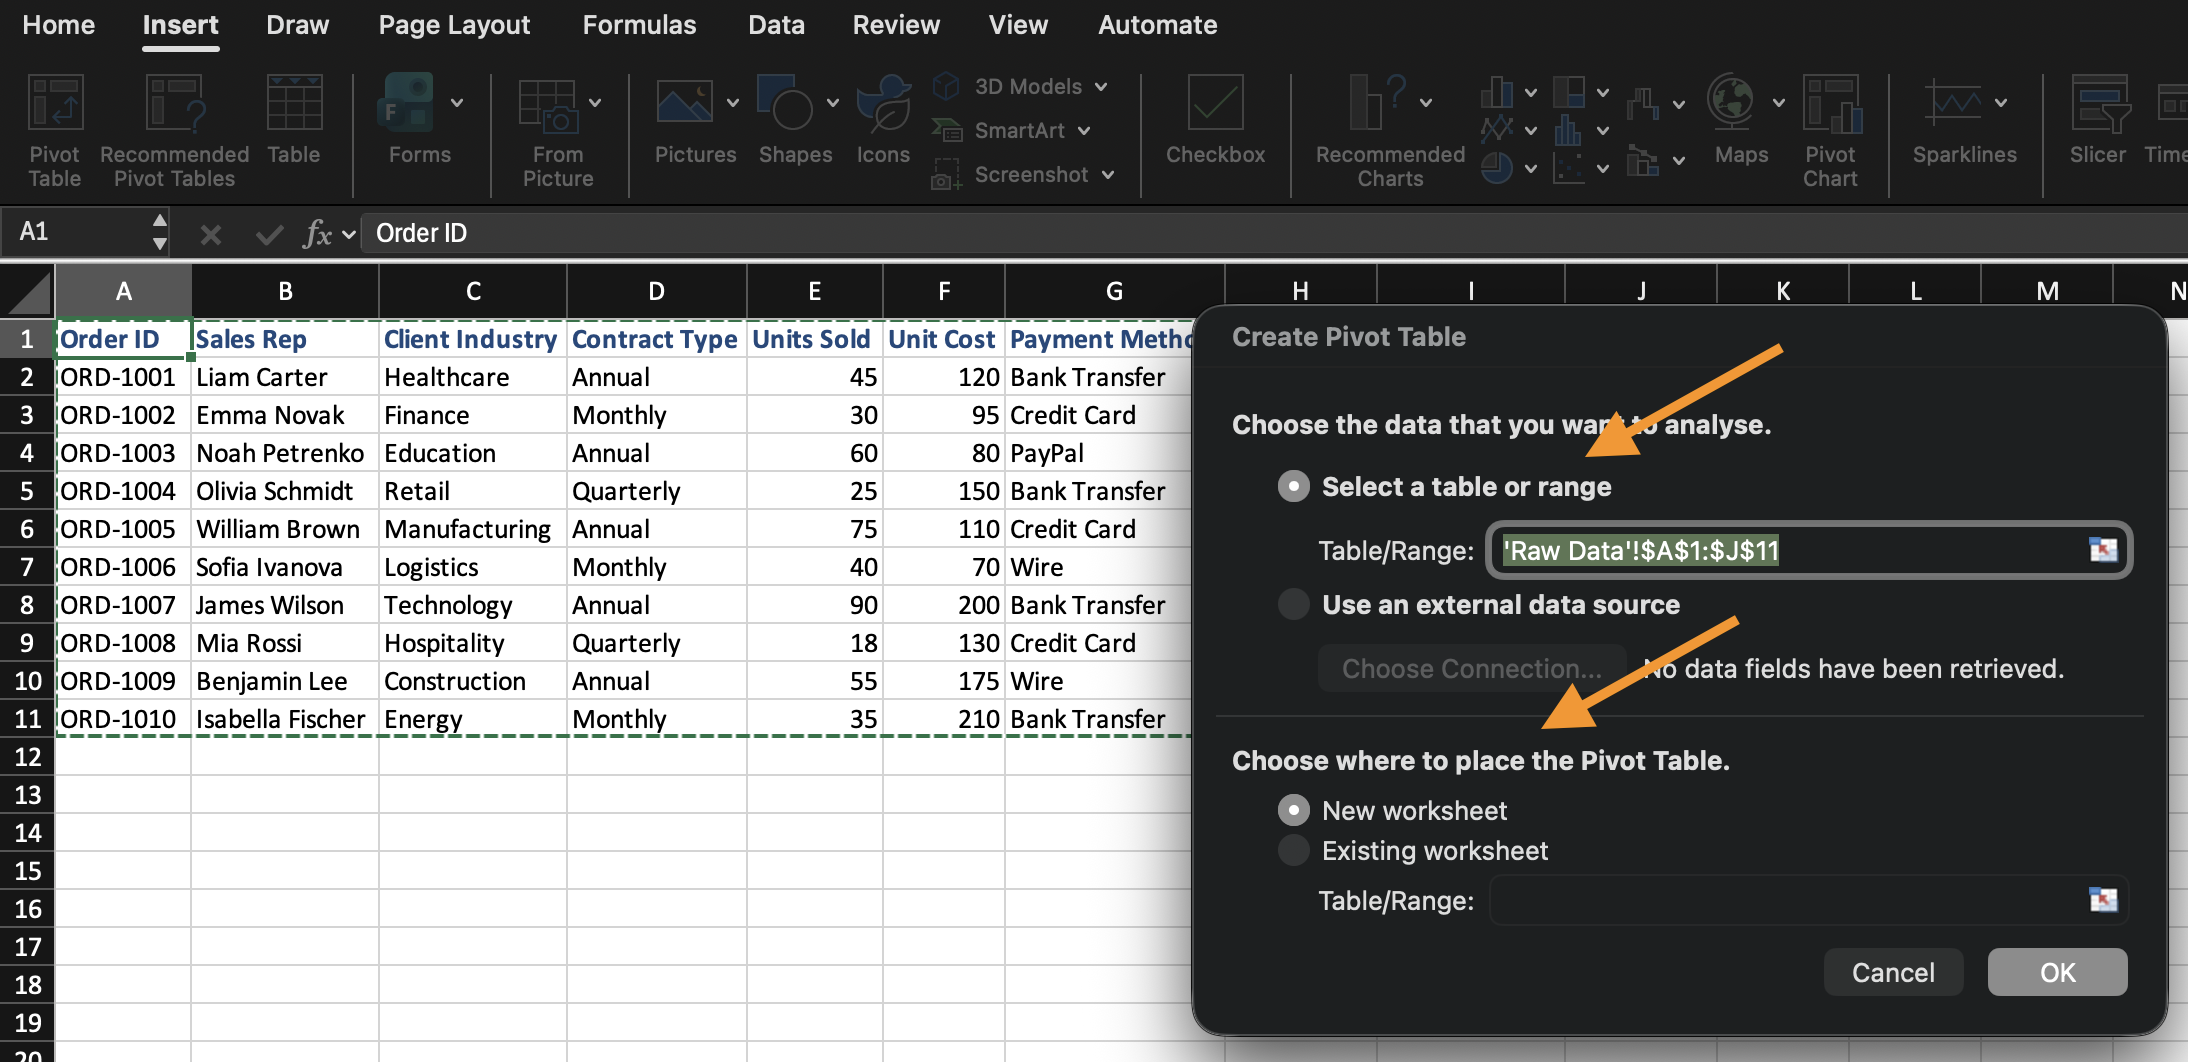
Excel creates an empty Pivot Table and opens the Pivot Table Field List.
Understanding the Field List Areas
The Field List controls how the Pivot Table is built. It's made up of four separate areas, and each one does something different with the field you place there:
- Rows: defines grouping. The field placed here becomes the labels your data is broken into (e.g. placing
Categoryhere creates one row per category); - Columns: also defines grouping, but across the top instead of down the side. Works the same way as Rows, just laid out horizontally;
- Values: defines calculations. Rather than just displaying the field, Excel aggregates it (Sum, Count, Average, etc.) across whatever grouping is set in Rows/Columns;
- Filters: narrows the entire Pivot Table down to a subset of data, without that field appearing in the visible table itself.
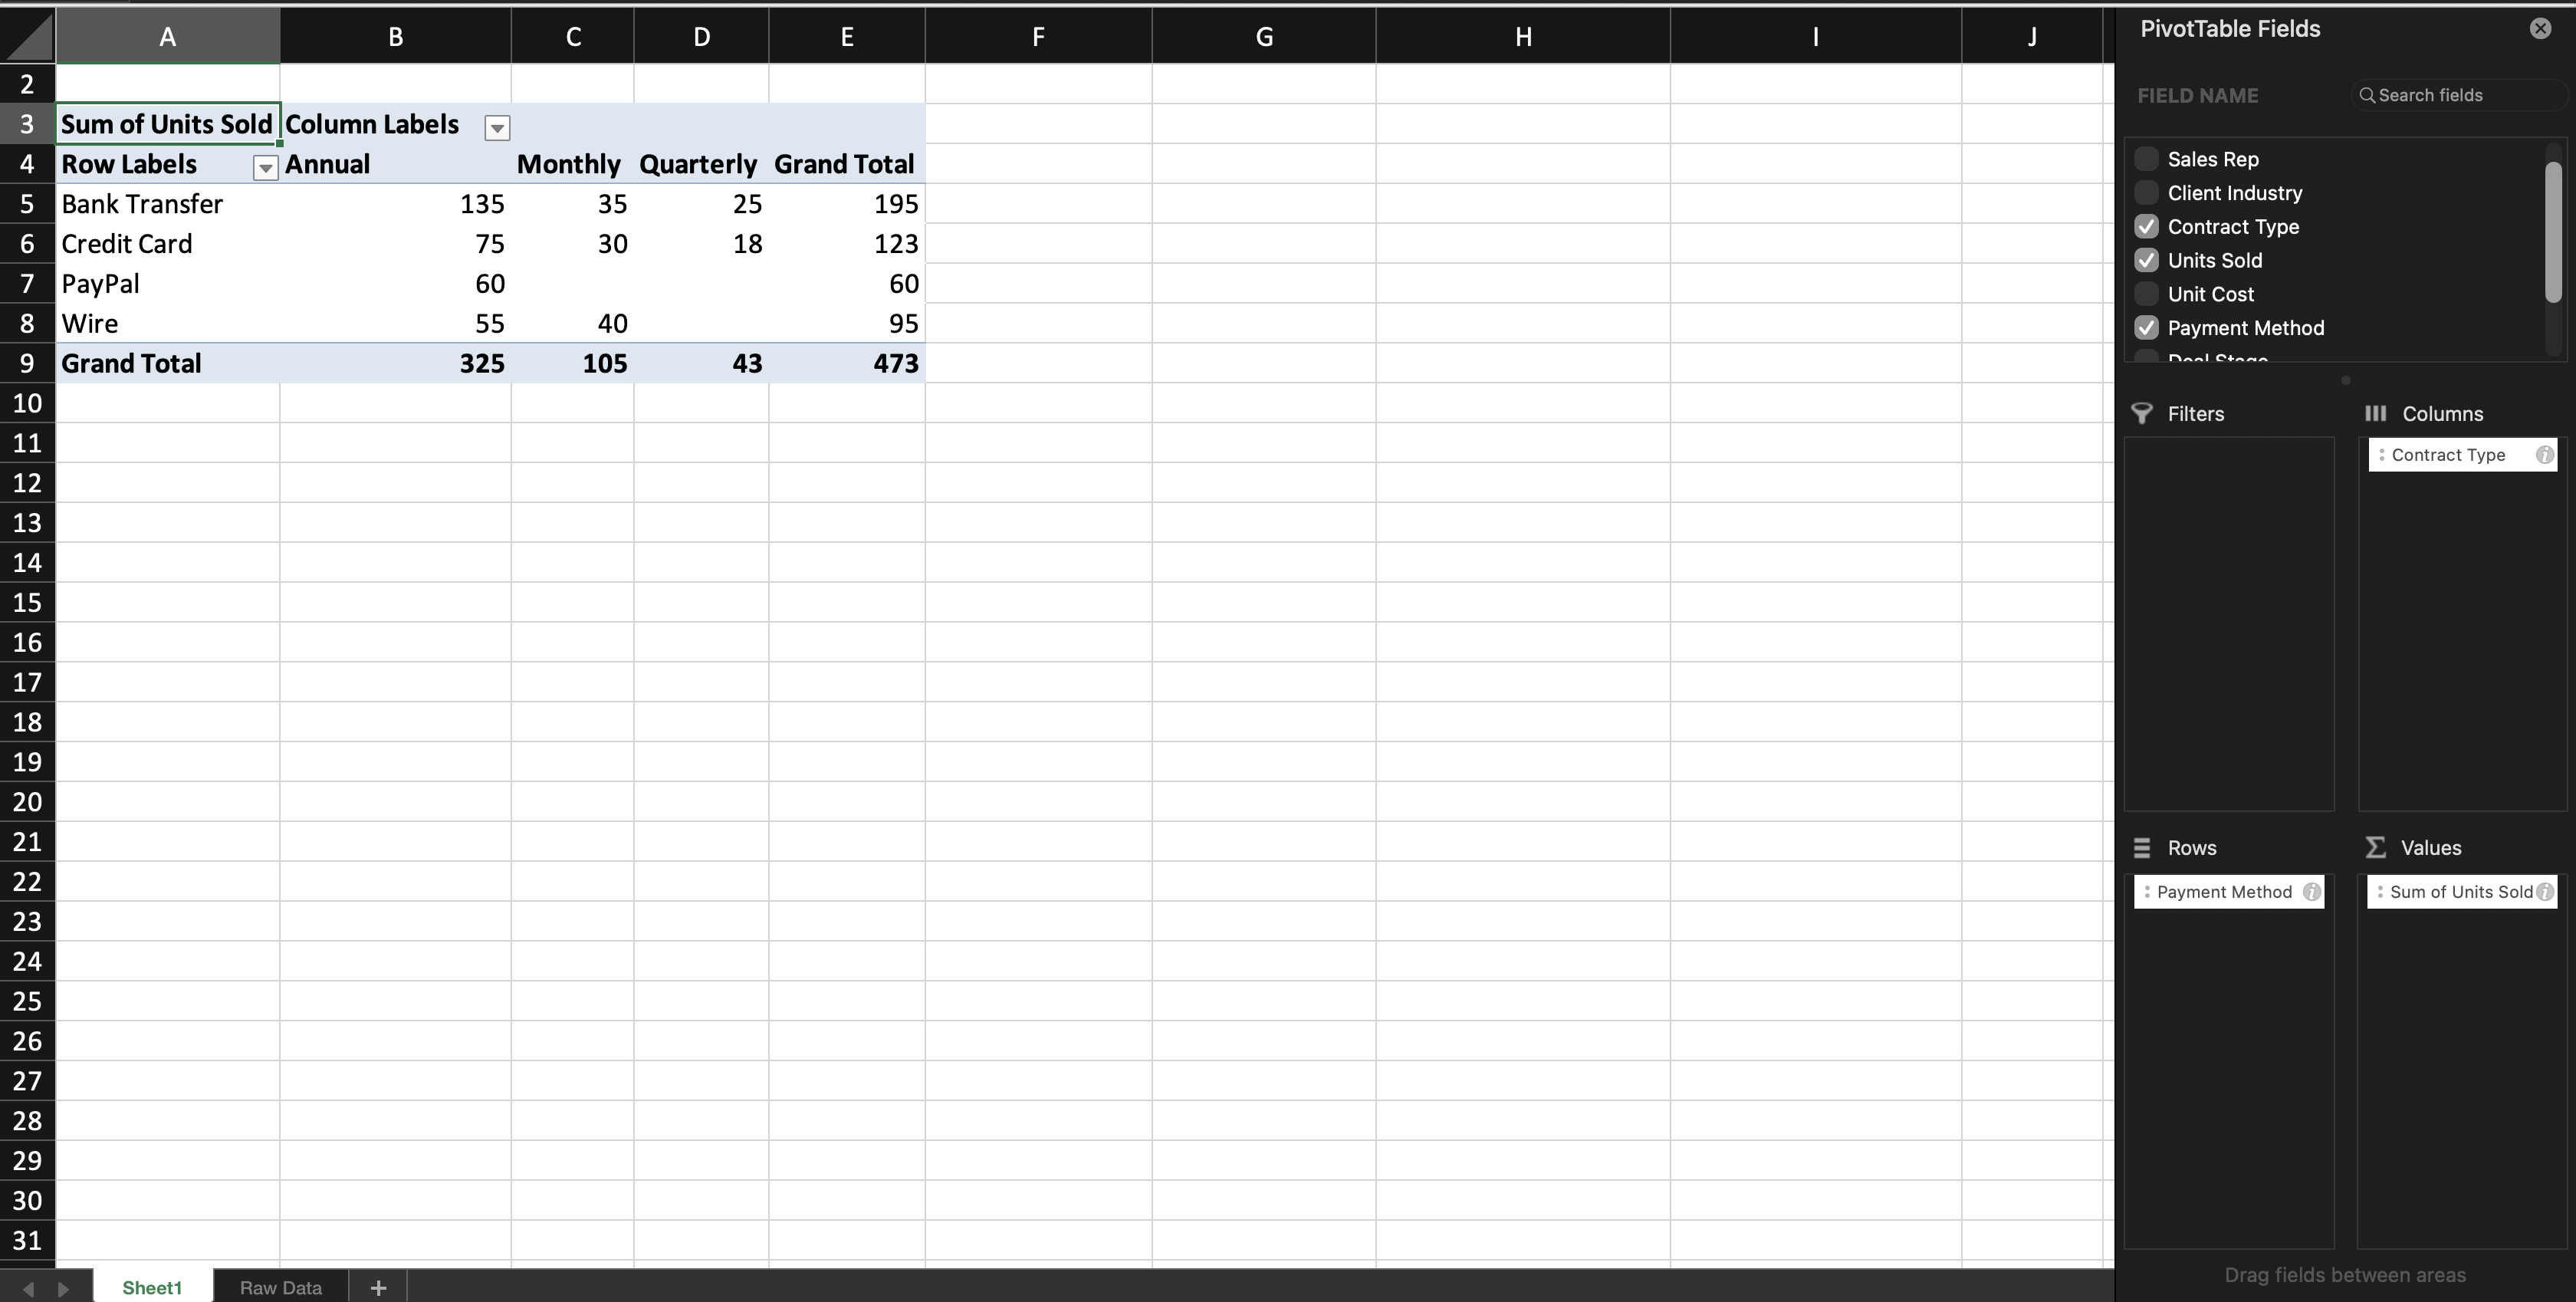
When you add a text field to Rows (or Columns), Excel groups records by that field. When you add a numeric field to Values, Excel calculates a total (Sum) by default — this default is based on the field's data type: numeric fields default to Sum, while text fields default to Count, since text values can't be summed. You'll learn how to change this default in the next chapter.
You can change the Pivot Table at any time by moving fields between areas. The source data is not changed.

If the PivotTable Field List panel closes, click anywhere inside the Pivot Table and it will appear again automatically.
Task
Create your first Pivot Table.
Do the following:
- Insert a Pivot Table from the dataset;
- Place Category in Rows;
- Place Sales in Values;
Create the Pivot Table on a new worksheet.
Thanks for your feedback!
Ask AI

Ask AI

Ask anything or try one of the suggested questions to begin our chat
