Welcome to Excel Adventure
Swipe to show menu
You've just made a great decision.
Whether you're here to handle data at work more confidently, level up your resume, or finally stop feeling lost when someone sends you a spreadsheet — this course will get you there.
No prior experience required. Just show up and follow along.
What Is Excel, Really?
At its core, Excel is a tool for organizing, calculating, and visualizing data. It's used by accountants, marketers, analysts, project managers, HR teams, and small business owners every single day. It's one of the most in-demand skills in the job market — and one of the most practical things you can learn right now.
The problem is that most people only use about 10% of what Excel can do. After this course, you'll be in a completely different league.
What You'll Learn
This course is built around five core skill areas — each one building on the last:
1. Organizing Data Like a Pro
You'll start by learning how to structure data properly — using ranges, tables, sorting, filtering, and validation rules that keep your spreadsheets clean and accurate.
2. Presenting Data Like a Pro
Raw data is hard to read. You'll learn formatting, alignment, conditional highlights, and layout techniques that make your spreadsheets look professional and easy to scan.
3. Calculating Data Like a Pro
This is where Excel's real power kicks in. You'll write formulas, work with functions, apply logical conditions, look up values across tables, and handle errors gracefully.
4. Visualizing Data Like a Pro
Numbers alone don't tell a story — charts do. You'll learn how to choose the right chart type, build it correctly, and make it readable at a glance.
5. Analyzing Data Like a Pro
In the final module, you'll bring everything together using PivotTables and interactive dashboards — the tools that turn raw data into real insights.
By the end, you'll be able to take a messy dataset and transform it into something clear, structured, and actionable.
How This Course Works
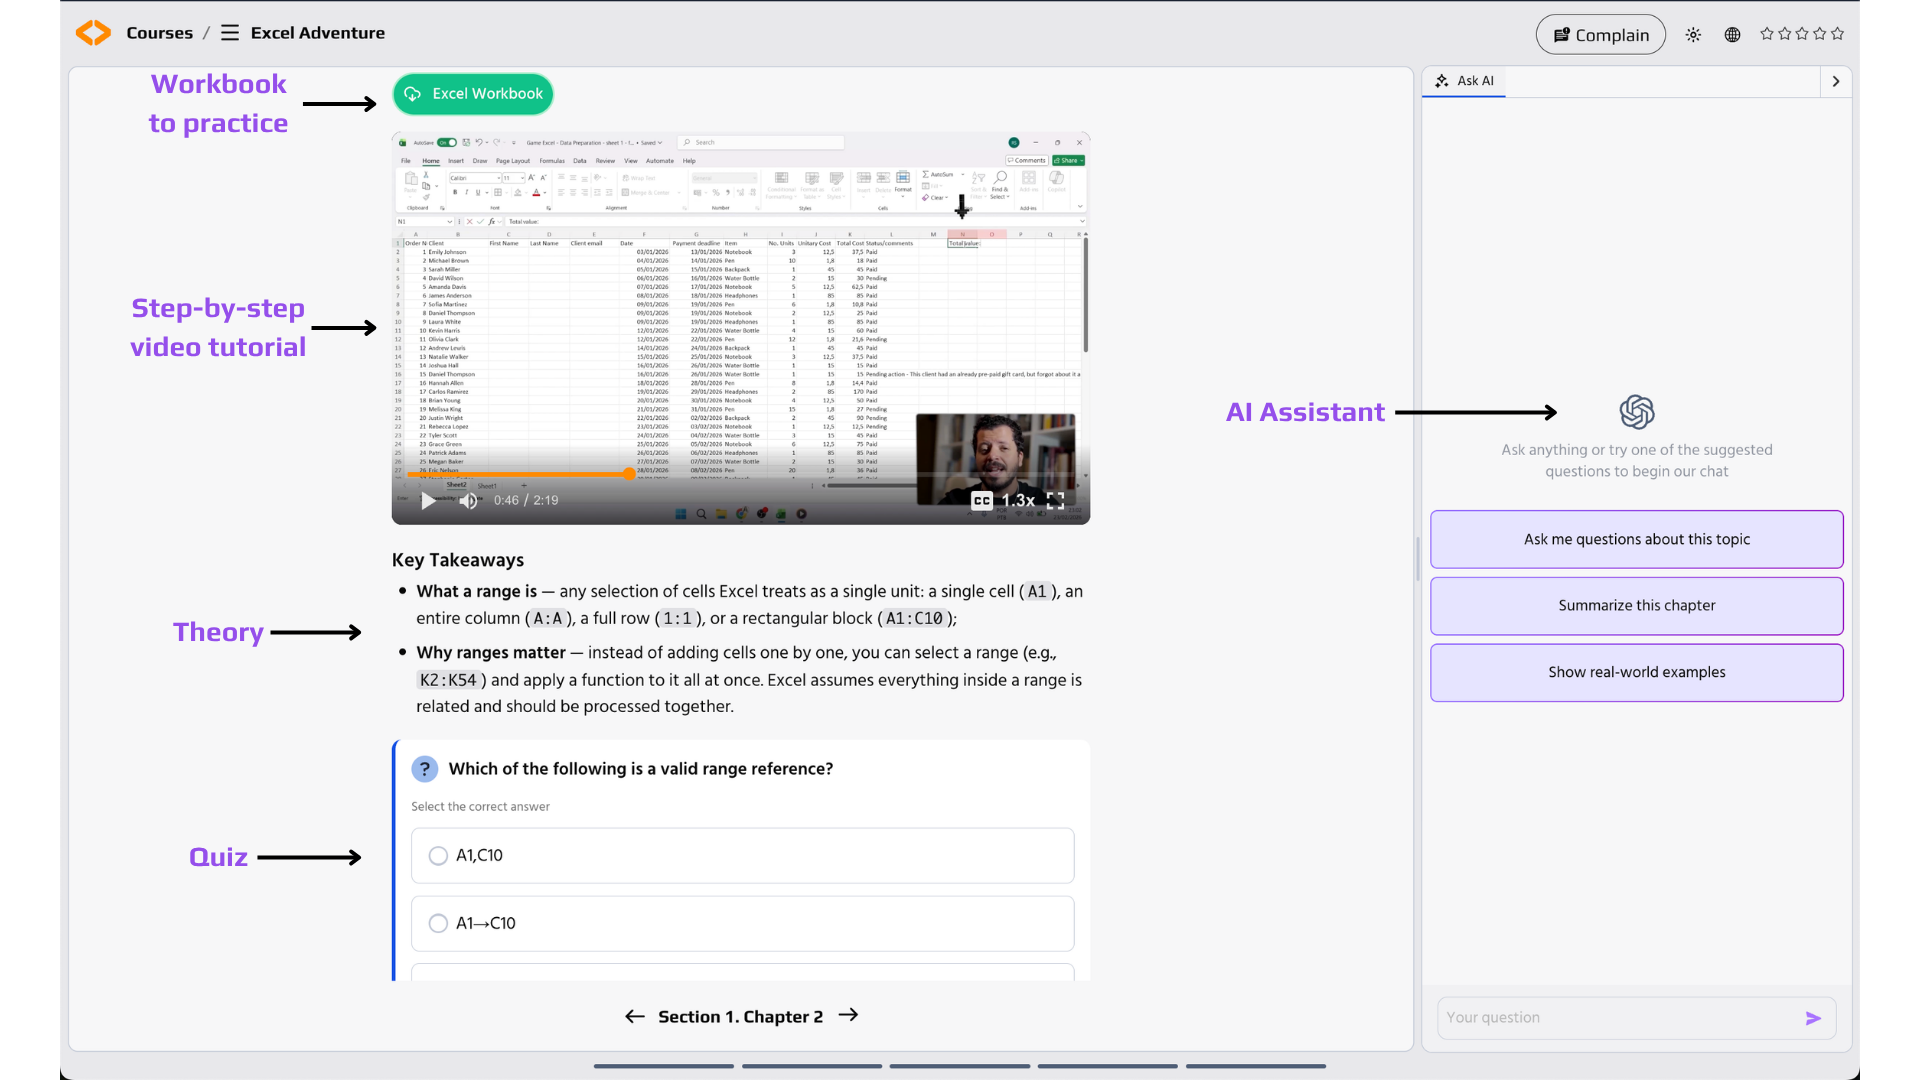
Each chapter focuses on one concept at a time — no overwhelming walls of information. Here's what to expect:
Short, focused theory. Every chapter explains one idea clearly, with examples that mirror real-world use cases. Read through it, don't rush.
Apply it yourself. The best way to learn Excel is to open it alongside the course and try things as you go. You'll absorb concepts much faster by doing, not just reading.
Knowledge checks. At the end of most chapters, there's a short quiz to confirm the concept landed. If something doesn't click, re-read the chapter — that's completely normal.
AI Assistant. Stuck on something? Use the built-in AI assistant anytime. Ask it to explain a concept differently, give you another example, or help you figure out why something isn't working.
Ready?
You're about to go from "I know the basics" — or even "I know nothing" — to someone who can confidently organize, analyze, and present data in Excel.
The first module starts with something deceptively simple: how data is actually structured in a spreadsheet. Get that right, and everything else becomes easier.
Thanks for your feedback!
Ask AI

Ask AI

Ask anything or try one of the suggested questions to begin our chat
Welcome to Excel Adventure
You've just made a great decision.
Whether you're here to handle data at work more confidently, level up your resume, or finally stop feeling lost when someone sends you a spreadsheet — this course will get you there.
No prior experience required. Just show up and follow along.
What Is Excel, Really?
At its core, Excel is a tool for organizing, calculating, and visualizing data. It's used by accountants, marketers, analysts, project managers, HR teams, and small business owners every single day. It's one of the most in-demand skills in the job market — and one of the most practical things you can learn right now.
The problem is that most people only use about 10% of what Excel can do. After this course, you'll be in a completely different league.
What You'll Learn
This course is built around five core skill areas — each one building on the last:
1. Organizing Data Like a Pro
You'll start by learning how to structure data properly — using ranges, tables, sorting, filtering, and validation rules that keep your spreadsheets clean and accurate.
2. Presenting Data Like a Pro
Raw data is hard to read. You'll learn formatting, alignment, conditional highlights, and layout techniques that make your spreadsheets look professional and easy to scan.
3. Calculating Data Like a Pro
This is where Excel's real power kicks in. You'll write formulas, work with functions, apply logical conditions, look up values across tables, and handle errors gracefully.
4. Visualizing Data Like a Pro
Numbers alone don't tell a story — charts do. You'll learn how to choose the right chart type, build it correctly, and make it readable at a glance.
5. Analyzing Data Like a Pro
In the final module, you'll bring everything together using PivotTables and interactive dashboards — the tools that turn raw data into real insights.
By the end, you'll be able to take a messy dataset and transform it into something clear, structured, and actionable.
How This Course Works
Each chapter focuses on one concept at a time — no overwhelming walls of information. Here's what to expect:
Short, focused theory. Every chapter explains one idea clearly, with examples that mirror real-world use cases. Read through it, don't rush.
Apply it yourself. The best way to learn Excel is to open it alongside the course and try things as you go. You'll absorb concepts much faster by doing, not just reading.
Knowledge checks. At the end of most chapters, there's a short quiz to confirm the concept landed. If something doesn't click, re-read the chapter — that's completely normal.
AI Assistant. Stuck on something? Use the built-in AI assistant anytime. Ask it to explain a concept differently, give you another example, or help you figure out why something isn't working.
Ready?
You're about to go from "I know the basics" — or even "I know nothing" — to someone who can confidently organize, analyze, and present data in Excel.
The first module starts with something deceptively simple: how data is actually structured in a spreadsheet. Get that right, and everything else becomes easier.
Thanks for your feedback!
