Editing Chart Data in Excel
This lesson focuses on editing chart data directly in Excel.
You will learn how to modify existing data series, add new ones, and remove unnecessary series to keep your charts accurate and up to date.
Key Points
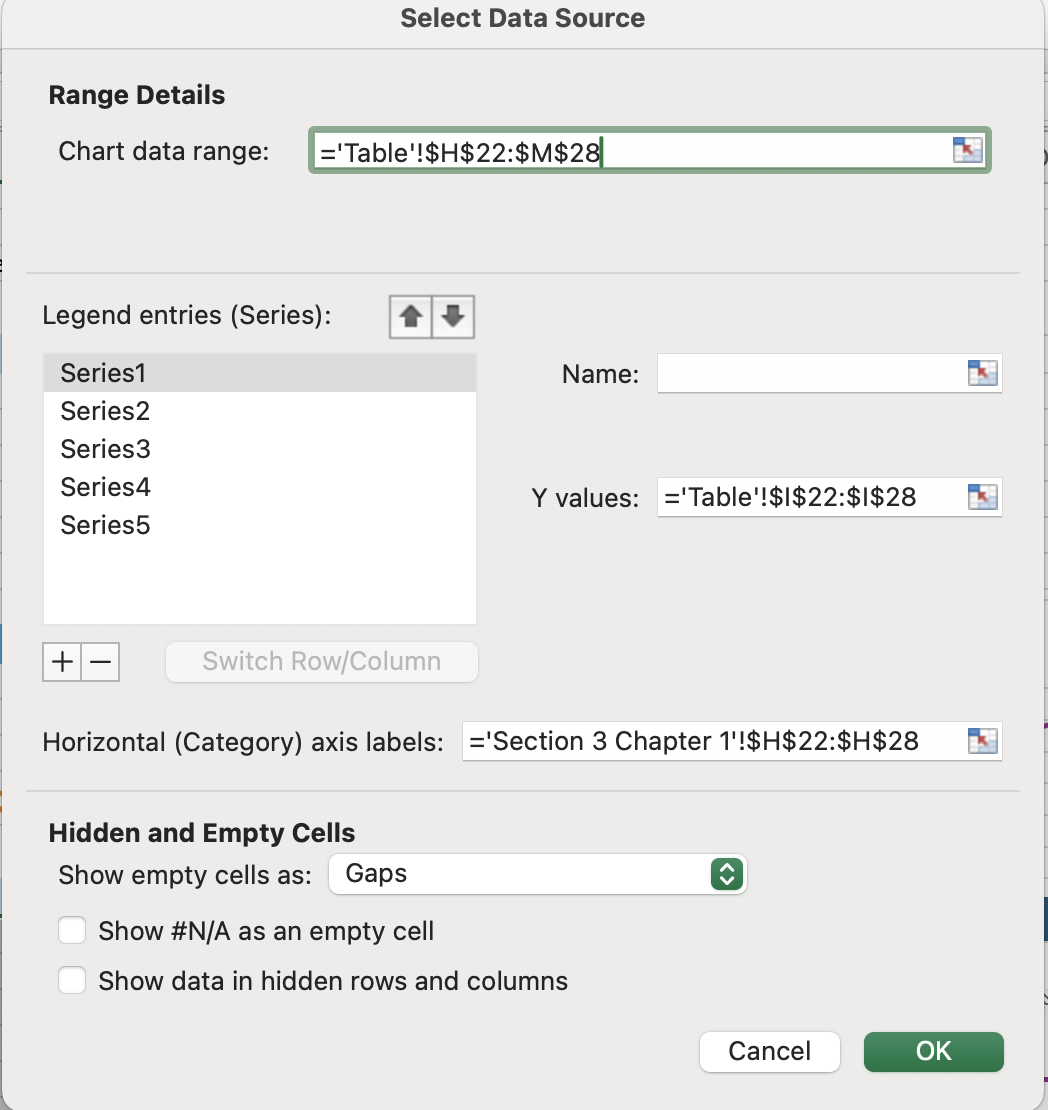
- Use the Chart Design tab → Data group → Select Data to edit existing data series by changing the series name or adjusting the data range;
- New data series can be added through the Select Data dialog by specifying the series name and values range;
- The Change Chart Type option in the Chart Design tab → Type group allows you to convert a chart to a different chart type, such as switching to a Clustered Column chart.
Everything was clear?
Thanks for your feedback!
Section 6. Chapter 6
Editing Chart Data in Excel
Swipe to show menu
This lesson focuses on editing chart data directly in Excel.
You will learn how to modify existing data series, add new ones, and remove unnecessary series to keep your charts accurate and up to date.
Key Points
- Use the Chart Design tab → Data group → Select Data to edit existing data series by changing the series name or adjusting the data range;
- New data series can be added through the Select Data dialog by specifying the series name and values range;
- The Change Chart Type option in the Chart Design tab → Type group allows you to convert a chart to a different chart type, such as switching to a Clustered Column chart.
Task
Swipe to start coding
Change the Revenue chart from a Pie chart to a Column chart.
- Excel workflow: click the
Revenuechart →Chart Designtab →Change Chart Type→Column→2-D Column→OK. - Platform workflow: click the
Revenuechart → click the button in the top-right corner → open the chart panel → change theChart Typefield toColumn Chart→Confirm.
 Switch to desktop for real-world practiceContinue from where you are using one of the options below
Everything was clear?
Thanks for your feedback!
Section 6. Chapter 6
Ask AI

Ask AI

Ask anything or try one of the suggested questions to begin our chat
