Notice: This page requires JavaScript to function properly.
Please enable JavaScript in your browser settings or update your browser.
Displot | Distributions of Data
Deep Dive into the seaborn Visualization
course content

Course Content

Deep Dive into the seaborn Visualization

Deep Dive into the seaborn Visualization

1. Light Start
2. Distributions of Data
3. Categorical Plot Types
4. Matrix Plots
5. Multi-Plot Grids
6. Regression Models

bookDisplot

Note

displot = FacetGrid(we will study this plot later) + histplot/kdeplot/ecdfplot

The displot provides access to several approaches for visualizing the univariate or bivariate distribution of data, including subsets of data defined by semantic mapping and faceting across multiple subplots.

The kind parameter selects the approach to use: histplot, kdeplot, ecdfplot.

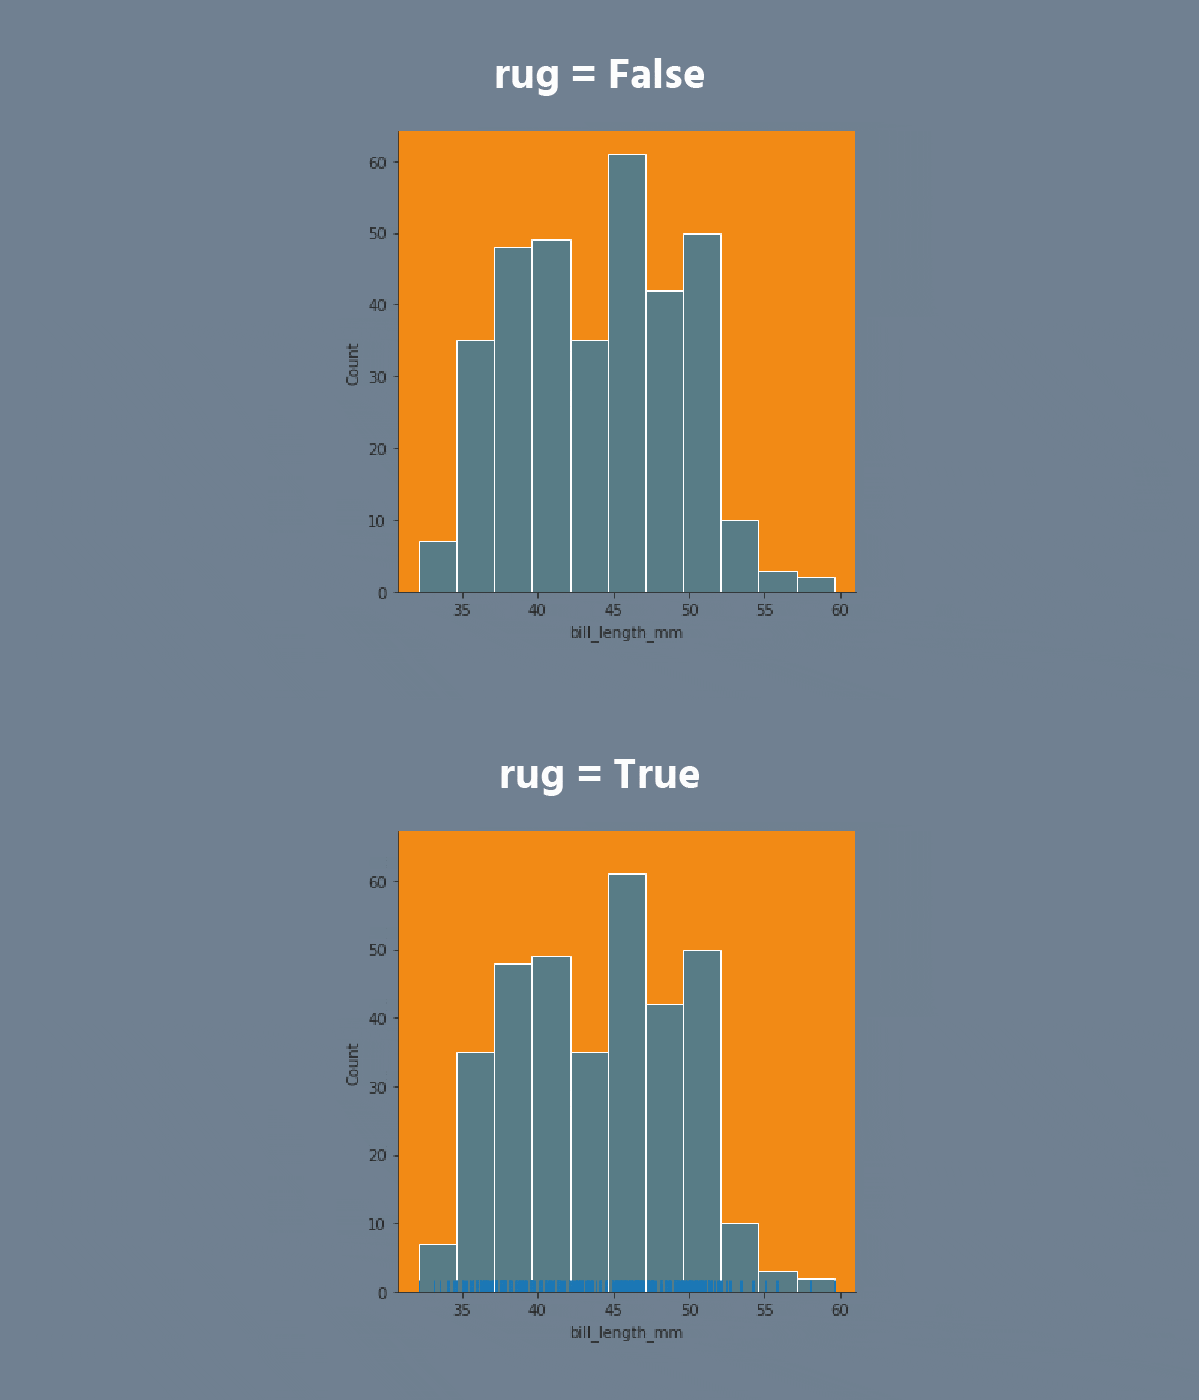
carousel-imgcarousel-imgcarousel-imgcarousel-imgcarousel-imgcarousel-imgcarousel-imgcarousel-imgcarousel-imgcarousel-img

Task

  1. Set the 'darkgrid' style.
  2. Create the displot using the seaborn library:
  • Set the x parameter equals the 'carat';
  • Set the hue parameter equals the 'cut';
  • Set the col parameter equals the 'color';
  • Set the kind parameter equals the 'kde';
  • Set the multiple parameter equals the 'fill';
  • Set the palette equals the 'viridis';
  • Set the data.

Switch to desktopSwitch to desktop for real-world practiceContinue from where you are using one of the options below
Everything was clear?

How can we improve it?

Thanks for your feedback!

Section 2. Chapter 6
toggle bottom row

bookDisplot

Note

displot = FacetGrid(we will study this plot later) + histplot/kdeplot/ecdfplot

The displot provides access to several approaches for visualizing the univariate or bivariate distribution of data, including subsets of data defined by semantic mapping and faceting across multiple subplots.

The kind parameter selects the approach to use: histplot, kdeplot, ecdfplot.

carousel-imgcarousel-imgcarousel-imgcarousel-imgcarousel-imgcarousel-imgcarousel-imgcarousel-imgcarousel-imgcarousel-img

Task

  1. Set the 'darkgrid' style.
  2. Create the displot using the seaborn library:
  • Set the x parameter equals the 'carat';
  • Set the hue parameter equals the 'cut';
  • Set the col parameter equals the 'color';
  • Set the kind parameter equals the 'kde';
  • Set the multiple parameter equals the 'fill';
  • Set the palette equals the 'viridis';
  • Set the data.

Switch to desktopSwitch to desktop for real-world practiceContinue from where you are using one of the options below
Everything was clear?

How can we improve it?

Thanks for your feedback!

Section 2. Chapter 6
toggle bottom row

bookDisplot

Note

displot = FacetGrid(we will study this plot later) + histplot/kdeplot/ecdfplot

The displot provides access to several approaches for visualizing the univariate or bivariate distribution of data, including subsets of data defined by semantic mapping and faceting across multiple subplots.

The kind parameter selects the approach to use: histplot, kdeplot, ecdfplot.

carousel-imgcarousel-imgcarousel-imgcarousel-imgcarousel-imgcarousel-imgcarousel-imgcarousel-imgcarousel-imgcarousel-img

Task

  1. Set the 'darkgrid' style.
  2. Create the displot using the seaborn library:
  • Set the x parameter equals the 'carat';
  • Set the hue parameter equals the 'cut';
  • Set the col parameter equals the 'color';
  • Set the kind parameter equals the 'kde';
  • Set the multiple parameter equals the 'fill';
  • Set the palette equals the 'viridis';
  • Set the data.

Switch to desktopSwitch to desktop for real-world practiceContinue from where you are using one of the options below
Everything was clear?

How can we improve it?

Thanks for your feedback!

Note

displot = FacetGrid(we will study this plot later) + histplot/kdeplot/ecdfplot

The displot provides access to several approaches for visualizing the univariate or bivariate distribution of data, including subsets of data defined by semantic mapping and faceting across multiple subplots.

The kind parameter selects the approach to use: histplot, kdeplot, ecdfplot.

carousel-imgcarousel-imgcarousel-imgcarousel-imgcarousel-imgcarousel-imgcarousel-imgcarousel-imgcarousel-imgcarousel-img

Task

  1. Set the 'darkgrid' style.
  2. Create the displot using the seaborn library:
  • Set the x parameter equals the 'carat';
  • Set the hue parameter equals the 'cut';
  • Set the col parameter equals the 'color';
  • Set the kind parameter equals the 'kde';
  • Set the multiple parameter equals the 'fill';
  • Set the palette equals the 'viridis';
  • Set the data.

Switch to desktopSwitch to desktop for real-world practiceContinue from where you are using one of the options below
Section 2. Chapter 6
Switch to desktopSwitch to desktop for real-world practiceContinue from where you are using one of the options below
some-alt