single
MinMaxScaler
Swipe to show menu
It's no secret that in order for machine learning algorithms to work correctly on our dataset, it must first be processed to become valid. We have already done some processing in the first part of the course, namely we worked with empty values as well as with categorical features. So it's time to move on. It is worth noting that machine learning algorithms work much better when numerical features scale up to a certain range.
There are two most popular methods of scaling numerical data: normalization and standardization. We will get acquainted with each of them separately. Let's start with normalization.
Normalization means changing the ranges in the data without changing the shape of the distribution. Here we are going to explore two normalization methods:
- MinMaxScaler - Normalization a feature value transformation technique that scales values so that they range from 0 to 1.
- MaxAbsScaler - Normalization a feature value transformation technique that scales values so that they range from -1 to 1.
We will start from MinMaxScaler.
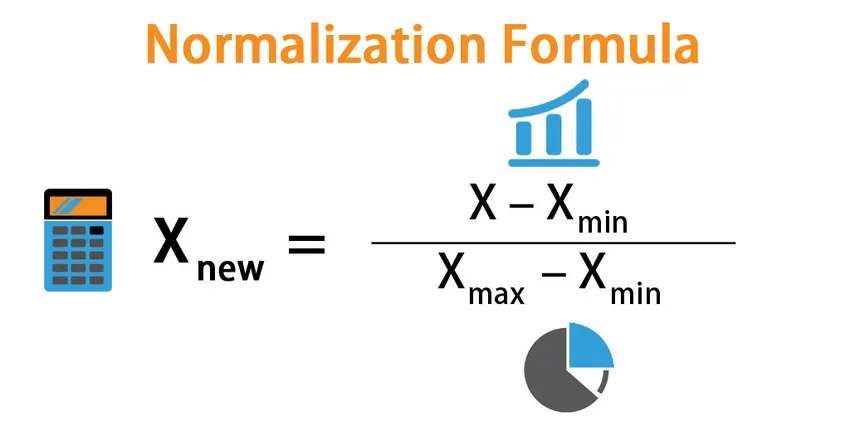
Here, we have the next values:
- X_new - normalized feature element,
- X - unnormalized feature element,
- X_min - minimuum feature element,
- X_max - maximum feature element.
There is a function in the sklearn library that normalizes data according to the formula given above: MinMaxScaler(). In order to work with this function, it must first be imported in such a way:
- Let's take a look at the another popular dataset about iris flowers and their features. See the example below.
1234import pandas as pd data = pd.read_csv('https://codefinity-content-media.s3.eu-west-1.amazonaws.com/42f1a712-b813-4962-89e7-43542d94fcff/wine1.csv') data.tail()
If you run this code you will get such a piece of dataset:

Here we have a dataset in which for 11 features (properties of wine, in our case -- 11 columns: fixed acidity, volatile acidity, ..., alcohol).
It can be seen that here, for example, the characteristics of total sulfur dioxide and density are very different. Since the second feature takes values from 0 to 1, and the first feature takes values that are clearly greater than the previous values (for example, 71 and 67). In this case, we simply need normalization. Let's look at how to do it with MinMaxScaler() function.
123456789101112from sklearn.preprocessing import MinMaxScaler import pandas as pd data = pd.read_csv('https://codefinity-content-media.s3.eu-west-1.amazonaws.com/42f1a712-b813-4962-89e7-43542d94fcff/wine1.csv') # Normalizer initialization scaler = MinMaxScaler() # Dataset transfer and transformation scaler.fit(data) scaled_data = scaler.transform(data) scaled_data_frame = pd.DataFrame(scaled_data, columns = ['fixed acidity', 'volatile acidity', 'citric acid', 'residual sugar', 'chlorides', 'free sulfur dioxide', 'total sulfur dioxide', 'density', 'pH', 'sulphates', 'alcohol']) print(scaled_data_frame.tail())
If you run this code you will get such a piece of dataset:

Now we see that all features in the dataset are normalized between 0 and 1.
Let's see sequentially what and how we did.
-
- We create a normalizer object
MinMaxScaler().
- We create a normalizer object
-
- Then we calculate the minimum and maximum to be used for subsequent scaling. This is done using function such as
.fit().
- Then we calculate the minimum and maximum to be used for subsequent scaling. This is done using function such as
-
- Then we apply the calculations that we have calculated in
fit()to every observation in features. This is done using function such as.transform(). After this process we got such a new variable asscaled_data.
- Then we apply the calculations that we have calculated in
But there is one problem, this function returns scales data in the form of numpy arrays. If you try to display the varialbe scaled_data on the screen, you will get an numpy array, not a data frame.
- Because of it, we have to make a Data Frame from that numpy arrays. We do it using
pd.DataFrame()function. Also we have added parametercolumnsto our DataFrame.
And as a result, we have our dataset with scaled values.
MinMaxScaler has an important parameter, feature_range , that controls the range we want to compress the data into. The default value is [0,1].
It's time to practice! Let's do it.
Swipe to start coding
You have the following avocado dataset: 
Here there are such information:
AveragePrice: The average price of a single avocado.Total Volume: Total number of avocados sold.4046: Total number of avocados with PLU 4046 sold.4225: Total number of avocados with PLU 4225 sold.4770: Total number of avocados with PLU 4770 sold.
Here you have to normalize your data using MinMaxScaler() function.
Please, display the resulted dataset on the screen in the DataFrame format not in numpy array.
Solution
Thanks for your feedback!
single
Ask AI
Ask AI

Ask anything or try one of the suggested questions to begin our chat
